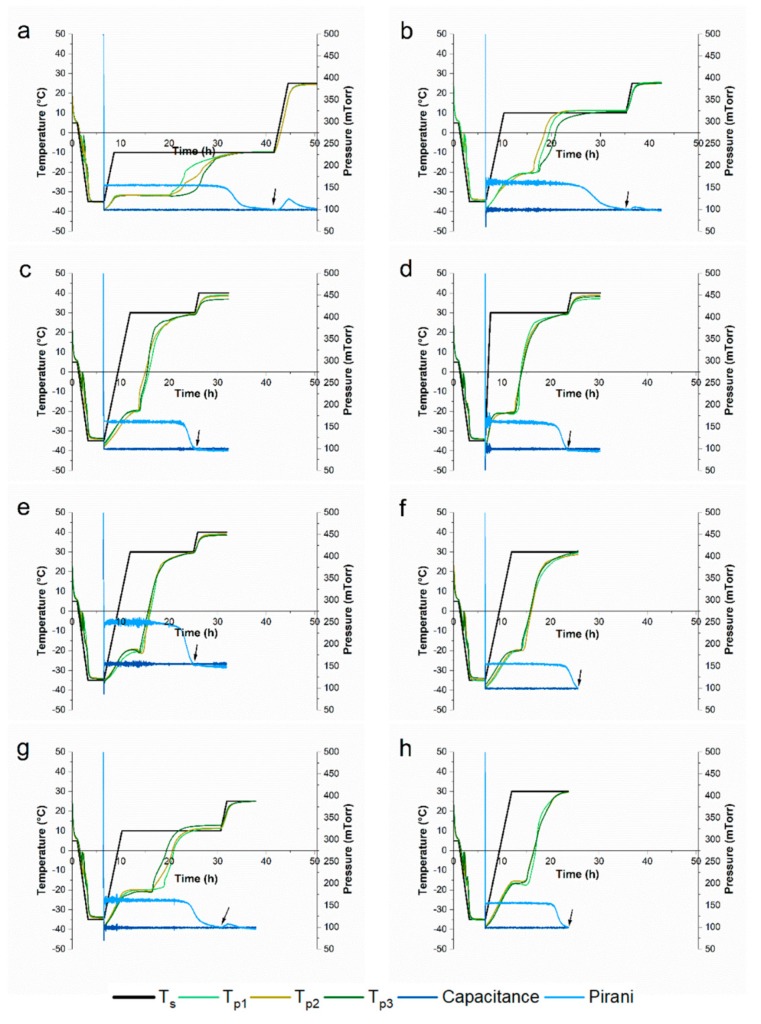
Figure 1.
Freeze-drying cycles. Process monitoring data of (a–f) 10 mg/mL mAb formulations and of (g–h) 50 mg/mL monoclonal antibody (mAb) formulations. (a) The conservative cycle (C0), (b,g) C1, (c) C2, (d) C3, (e) C4, and (f,h) C5. The arrow indicates end of primary drying. Ts = shelf temperature; Tp = product temperature determined by thermocouples.

