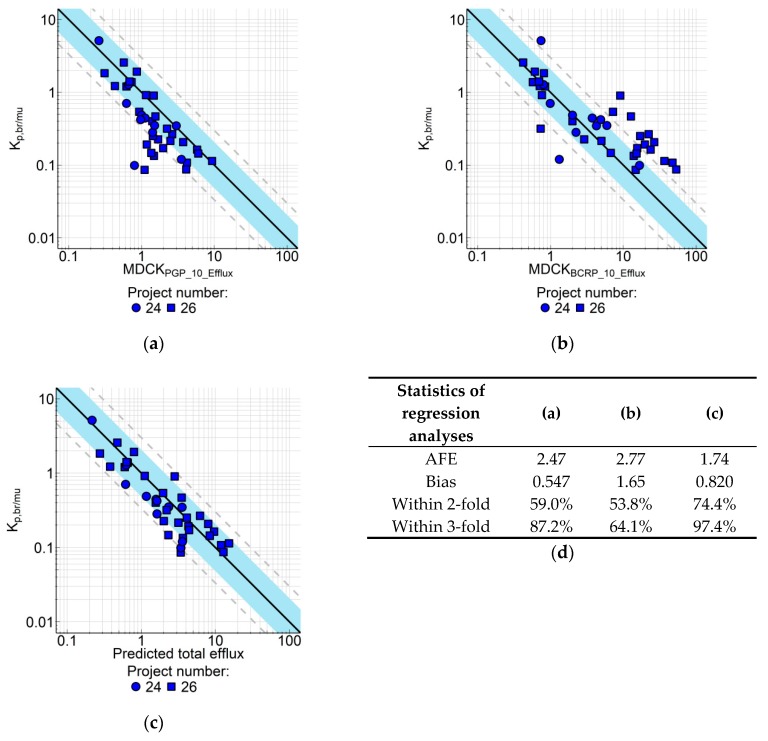
Figure 6.
Correlation of Kp,br/mu with in vitro efflux measured in MDCK-MDR1 and breast cancer resistance protein transfected Madin-Darby canine kidney (MDCK-BCRP) cells for compounds from two research projects (n = 39). In vitro efflux determined at 10 µM compound concentration in (a) MDCK-MDR1 cells or (b) MDCK-BCRP cells was correlated with Kp,br/mu. (c) Correlation of Kp,br/mu with in vitro efflux calculated using equation (17). (d) Regression line statistics. Solid line represents regression; blue area is the 2-fold error range, dashed lines indicate 3-fold error. Symbols represent average values (n = 2–3 for Kp,br/mu and n = 2 for in vitro efflux). Data are listed in Supplement Table S6.

