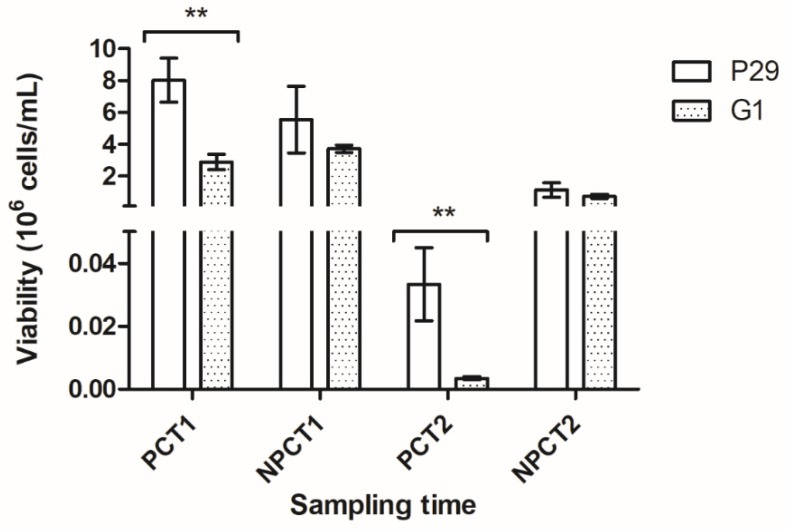
Figure 2.
Cell viability (cells/mL) observed in both S. cerevisiae yeast strains P29 and G1 under PC (CO2 pressure condition) and NPC (non-CO2 pressure condition), in each sampling time: at the middle of the secondary fermentation (T1) and 1 month after the secondary fermentation (T2). Error bars represent the standard deviation of the three independent experiments. Significant differences from One-way ANOVA analysis are indicated by *, depending on the significance level (** < 0.01).

