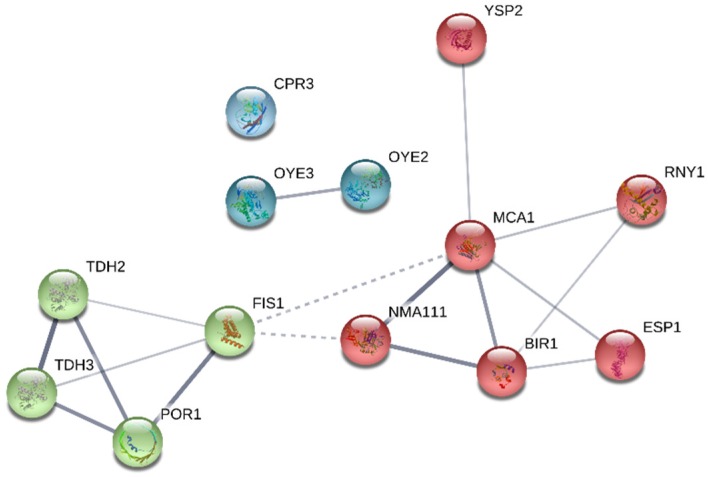
Figure 3.
Interaction network map built using STRING v11.0 and based on the 13 apoptosis-related proteins in total detected in S. cerevisiae P29 and G1. Proteins are shown as nodes and the existence of interactions between them are represented by edges (connection between nodes). Edges thickness indicates the strength of the different interactions. Nodes with the same color represent specific clusters. PPI enrichment p-value < 6.21 × 10⁻¹⁰.

