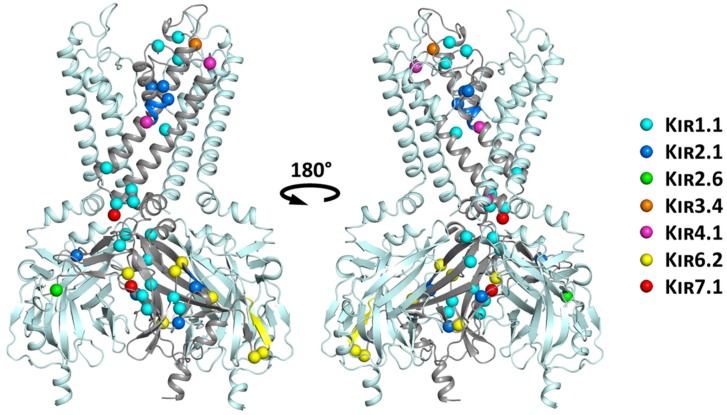
Figure 6.
Structural mapping of trafficking mutants mapped on the KIR2.2 structure. For clarity reasons, only three of the four subunits are shown in side view, with the disease associated mutations highlighted in one subunit only. Mutations of different KIR channel family members are color-coded and shown as spheres of their respective Cα atoms. Deletions are indicated by colored regions on the secondary structure elements.

