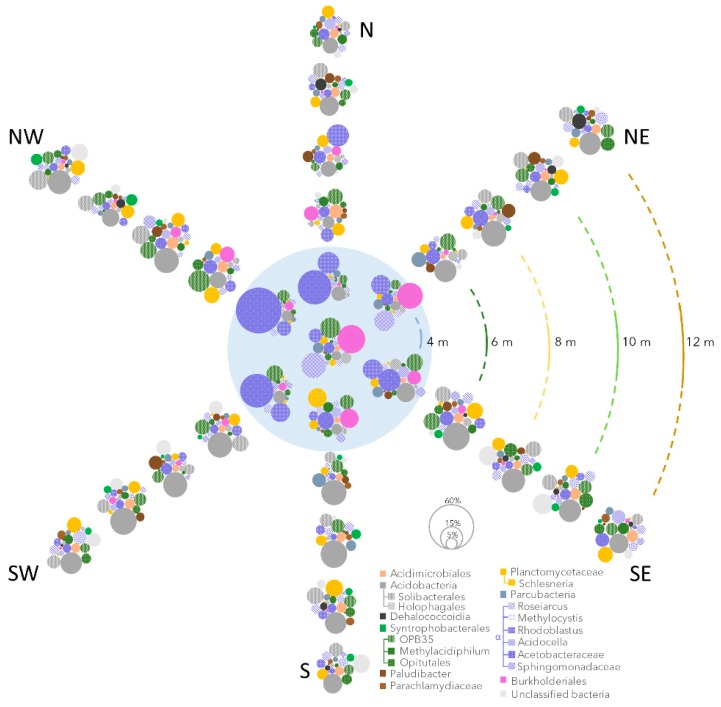
Figure 5.
Relative proportions of bacterial 16S rRNA genes and their taxonomic affiliations, in all samples from the centre of the pond, represented as the pale blue circle, to 12 m distance across the peatland. The size of the dots represents the relative proportion of the lineages, and colors indicate the lineages: green, Verrucomicrobia; yellow, Planctomycetes; purple, Alphaproteobacteria; and grey, Acidobacteria.

