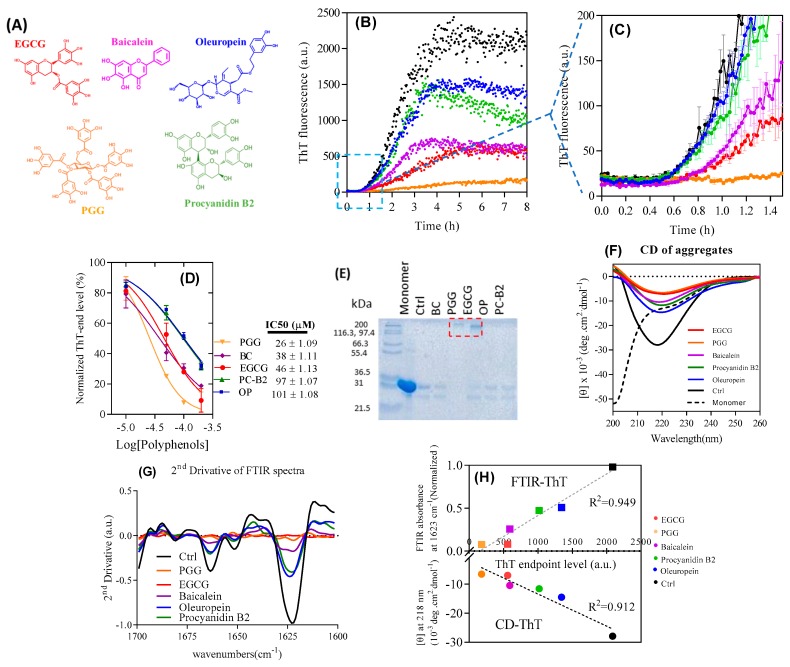
Figure 1.
Effect of polyphenols on fibrillation-prone protein (FapC)-UK4 fibrillation. (A) Structures of compounds used in this study. Compound colors correspond to the label colors in subsequent graphs; (B) time course of fibrillation of 30 µM FapC with 100 µM polyphenols at pH 7.5 and 37 °C monitored by Thioflavin T (ThT) fluorescence (C) and zoom-in in (A); (D) IC50 values for inhibition of fibrillation based on data in panel b; (E) SDS-PAGE of samples after incubation with polyphenols. Red box highlights the oligomer band; (F) Circular Dichroism (CD) and (G) ATR-FTIR of samples from panel A after the end of incubation. 1623 and 1663 cm−1 peaks are attributed to β-sheet; (H) correlation between ATR-FTIR/CD and ThT endpoint levels.

