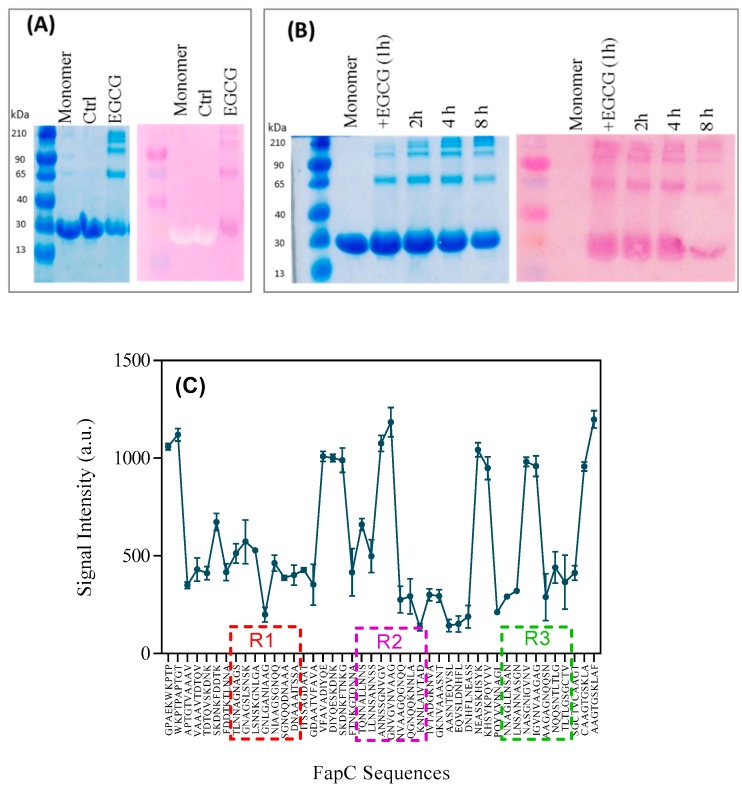
Figure 6.
NBT-assay demonstrating polyphenol interactions with FapC. (A) Right: SDS-PAGE of oligomers separated by SEC, left: A copy of the same SDS-PAGE gel was electroblotted onto PVDF membrane and stained with NBT; (B) time study of the EGCG-FapC interaction using (right) SDS-PAGE) and (left) NBT-stained PVDF membrane, respectively. Samples were taken out at the indicated times and frozen before running on the gel; (C) signal intensities of peptide array displaying peptides corresponding to different sequences of FapC, incubated with EGCG, and stained with NBT to identify interacting sequences.

