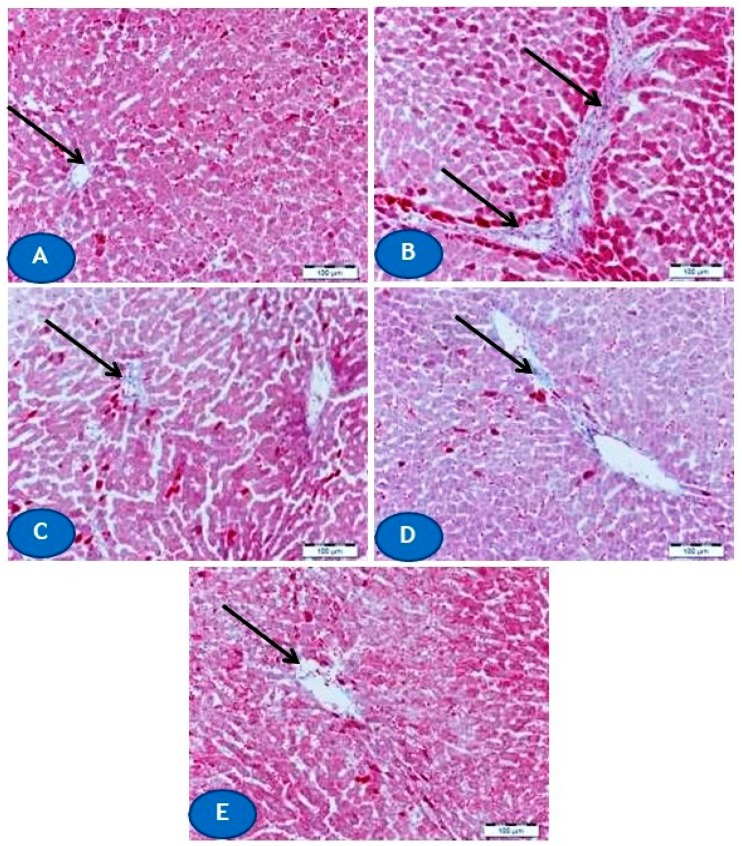
Figure 3.
Photomicrographs of Masson’s trichrome (MT)-stained sections from liver of (A) control rats showing normal amount and distribution of collagen fibers around blood vessels (arrow), (B) Pb(II)-intoxicated rats showing an increase in collagen deposition (arrows), and (C–E) Pb(II)-administered rats treated with CUR (C) and AA (D) showing marked decrease in collagen deposition (arrow), and CUR/AA (E) showing apparently normal distribution of collagen fibers (arrow). (X400, Scale bare 50 µm).

