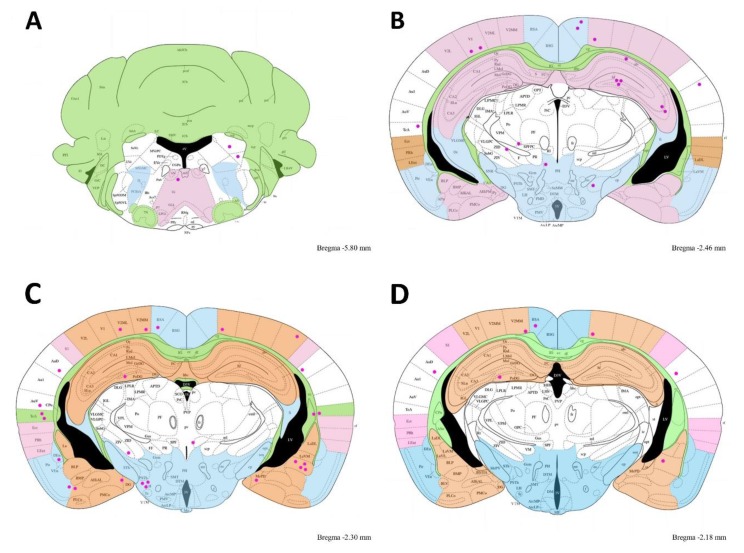
Figure 6.
Brain schematic representing the cyst distribution in the mouse 7 from bregma −1.94 to 1.34. The cuts are from a bregma distance indicated in the Figure in small leter in the right corner of each cut. Cysts are pink dots. Note cyst groupings found in the hippocampus, temporal and auditory cortex, amygdaline nucleus and hypothalamus.

