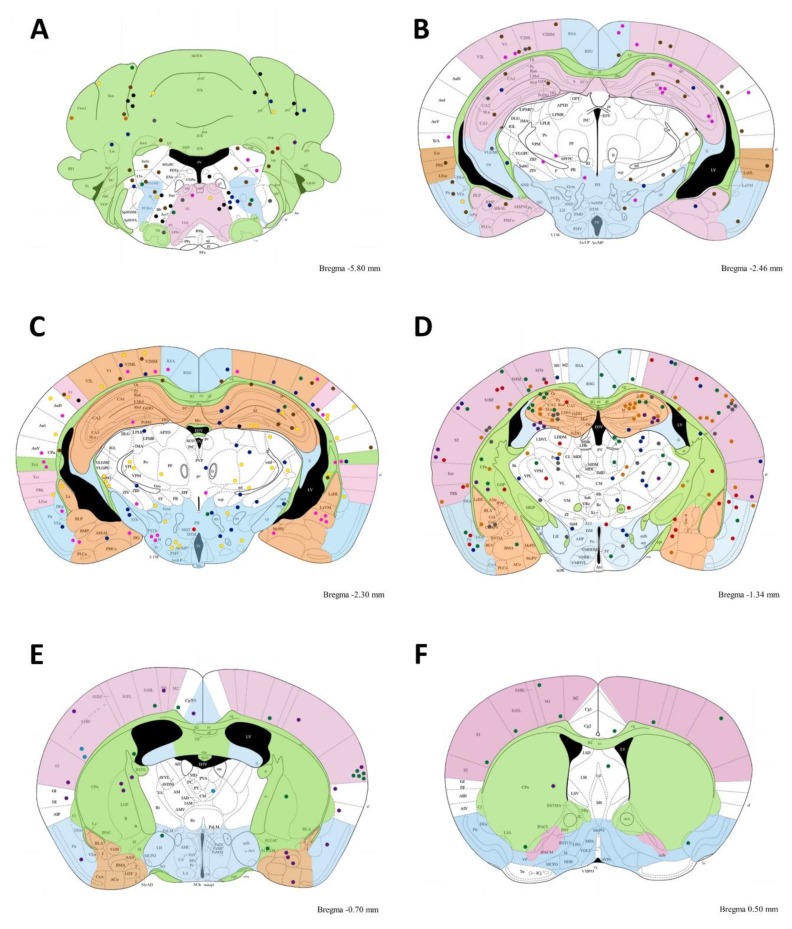
Figure 7.
Brain schematic representing the cyst distribution accumulation. Grouping cysts between several rostral cuts in chronic infected mice. T. gondii cyst distribution. The figure illustrates several coronal histological cuts from bregma −6.0 to bregma 0.38. Abbreviations indicate the brain zones (see abbreviation list). A–FA; B; C; D; E; F;) Dots indicate brain cyst localization in twelve mice at a bregma distance indicated on the Figure for each cut. (A) Grouped cysts from bregma −6.0 to −5.8, (B) grouped cysts from −2.54 to −2.46, (C) grouped cysts from −2.06 to −2.30, (D) grouped cysts from −1.94 to −1.34, (E) grouped cysts from −0.94 to −0.70, and (F) grouped cysts from 0.38 to 0.50. Note in A there is cyst accumulation in Acs7, Irt, and Pa6. Additionally, in (D), there is cyst accumulation in the hippocampal zones and SIBF zone; (E) shows cyst accumulations in S2. All cysts pink color correspond to those illustrate in Figure 6.

