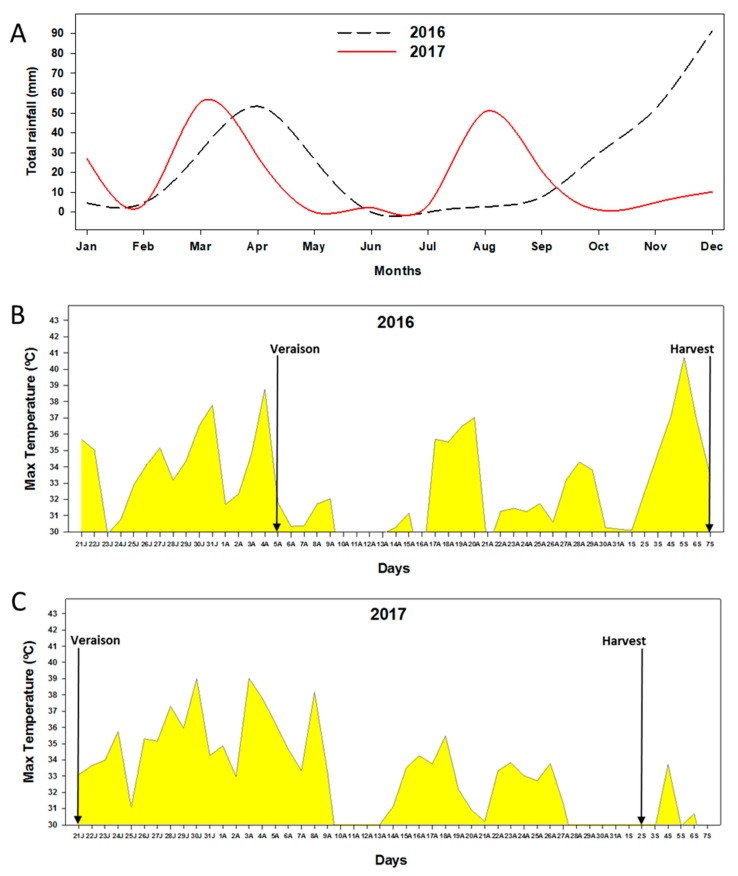
Figure 1.
(A) Monthly evolution of rainfall recorded on the experimental farm during 2016 and 2017. (B) Daily evolution of maximum temperatures (above 30 °C) recorded on the experimental farm during 2016. (C) Daily evolution of maximum temperatures (above 30 °C) recorded on the experimental farm during 2017.

