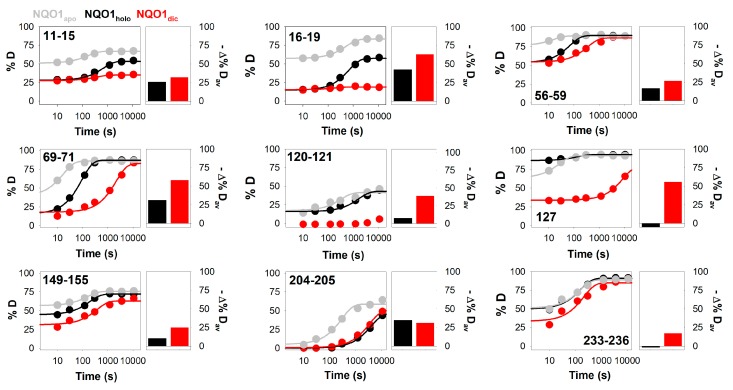
Figure 6.
Changes in segment-specific HDX kinetics of NQO1 upon FAD and dicoumarol binding. Right panels show fittings of HDX kinetics for selected individual segments using a single exponential function with a burst-phase for NQO1apo (grey), NQO1holo (black) and NQO1dic (red). These data were used to calculate Δ%Dav, as an average of the time points with maximal differences between a given NQO1 form (NQO1holo, black; NQO1dic, red) and NQO1apo, as a single metric to quantify changes in HDX kinetics (left panels).

