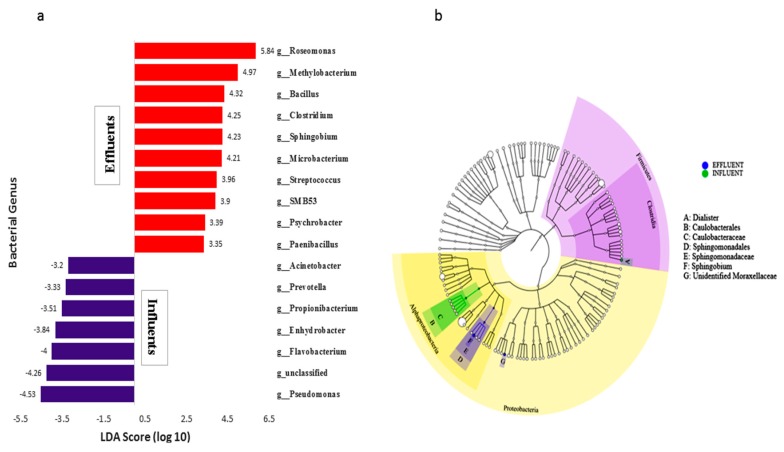
Figure 5.
(a) Linear discriminant analysis (LDA) effect size (LEfSe) analysis showed differentially abundant genera as biomarkers determined using the Kruskal–Wallis test (p < 0.05), with LDA scores > 3.5. (b) Cladogram representation of the differentially abundant orders, families, and genera. The root of the cladogram denotes the domain Bacteria, and the size of each node represents its relative abundance.

