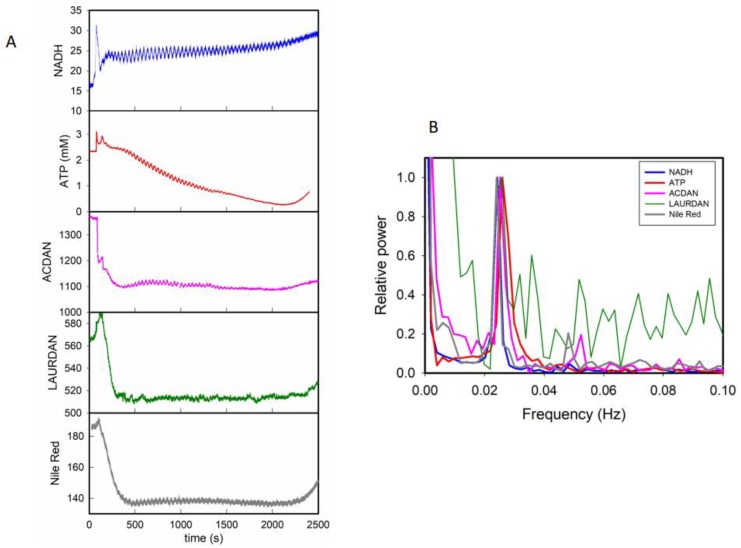
Figure 1.
Oscillations in NADH, intracellular ATP, and the fluorescence of ACDAN, LAURDAN, and Nile red were synchronized. (A) Oscillations in NADH fluorescence, intracellular ATP concentration, ACDAN fluorescence, LAURDAN fluorescence, and Nile red fluorescence in a cell suspension with oscillating glycolysis. The cell suspension was 10% (w/v) S. cerevisiae BY4743 in 100 mM potassium phosphate buffer, pH 6.8, and temperature of 25 °C. Oscillations in glycolysis were induced at approximately t = 100 s by adding 30 mM glucose and 5 mM KCN to the cell suspension. (B) Power spectra of the oscillations in (A). Experimental details can be found in the Materials and Methods section.

