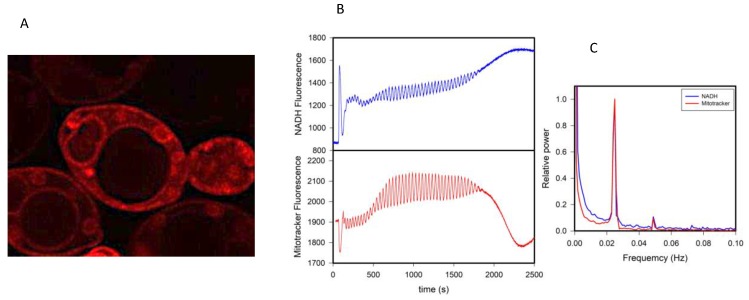
Figure 3.
Membrane probes such as Mitotracker red may respond to changes other than membrane potential. (A) Fluorescence image of S. cerevisiae BY4743 cells stained with 1 μM Mitotracker red. (B) Oscillations in the fluorescence of NADH and Mitotracker red in a suspension of yeast cells where oscillations in glycolysis were induced by the addition of glucose and KCN as seen in Figure 1. (C) Power spectra of the oscillations in (B). Experimental details can be found in the Materials and Methods section.

