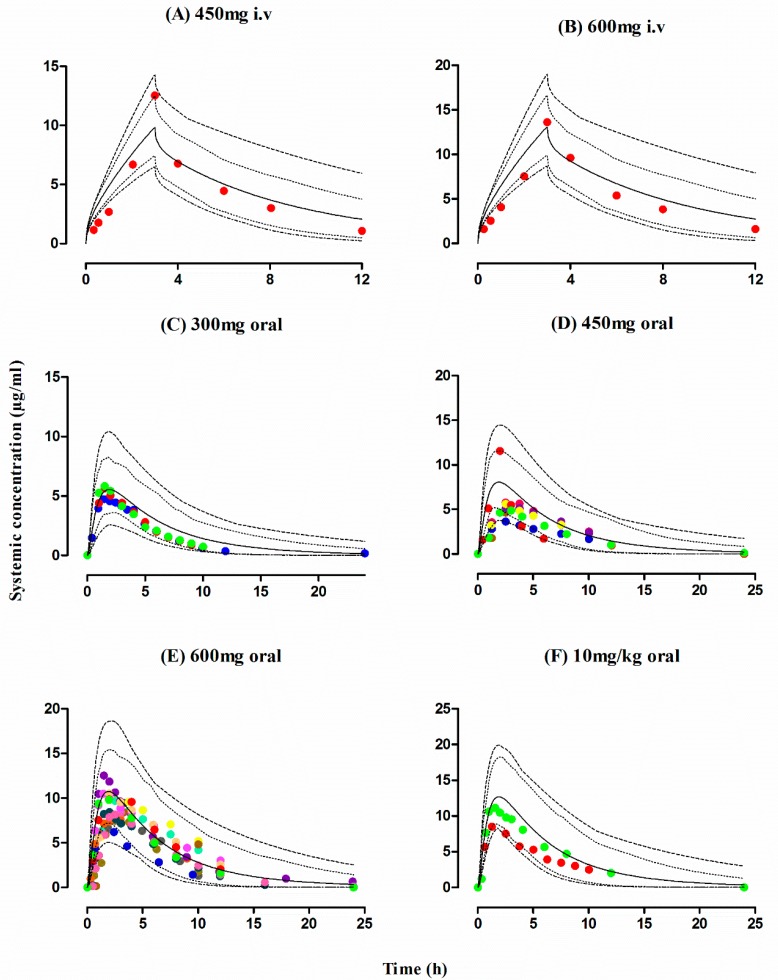
Figure 2.
Observed and predicted plasma concentration-time profiles of rifampicin in healthy adults after iv and oral administration. Healthy individual after i.v administration: (A) 450 mg, (B) 600 mg [40]. Healthy individual after oral administration: (C) 300 mg [41,49], (D) 600 mg [26,27,28,42,43,44,45,46], (E) 450 mg [37,45,48], (F) 10 mg/kg [15,47]. The observed data are shown as filled colored circles. The predicted results are shown as mean (solid line), maximum value and minimum value (dashed line) and the 5th–95th percentiles (dotted line).

