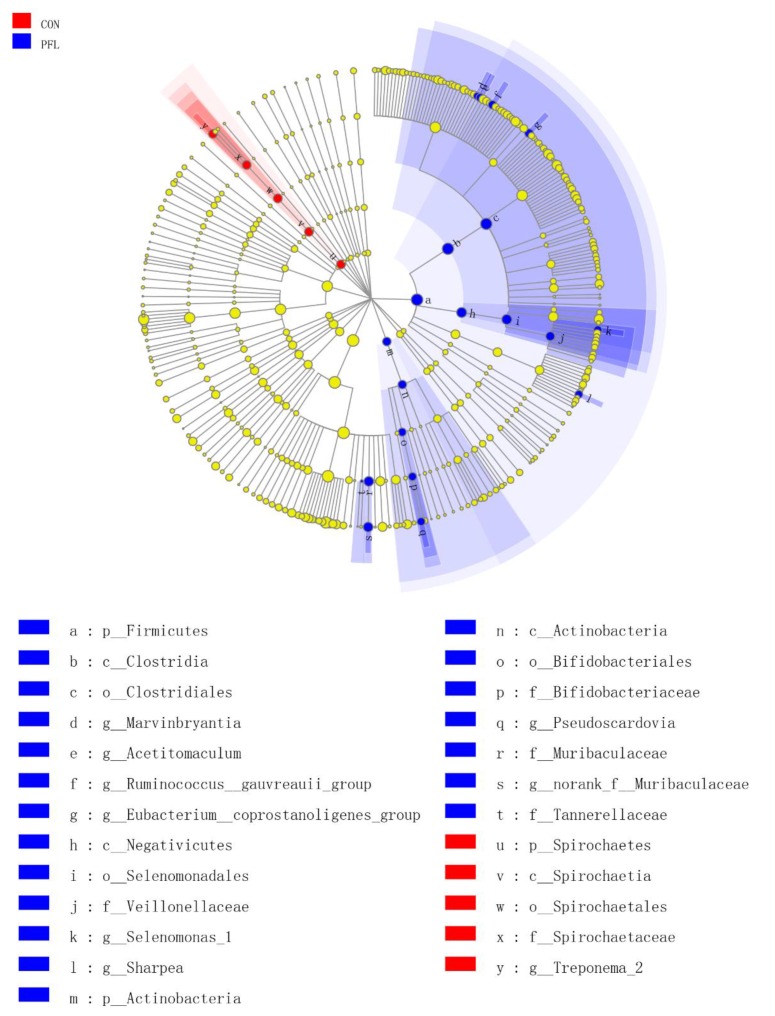
Figure 3.
The ruminal bacteria (highlighted by small circles and by shading) showing different abundance values between Perilla frutescens leaf (PFL) and control (CON) groups. There are six layers from the inside of this plot to the outside, corresponding to six levels of taxonomy (kingdom, phylum, class, order, family, and genus). Each node (small circle) represents a taxon. Blue and red nodes represent the bacterial community of PFL with the significant higher and lower abundance in PFL compared with that in the CON group, respectively. Yellow nodes indicate the bacteria that are not statistically and biologically differentially between the two groups. The diameter of each circle is proportional to the taxon’s abundance.

