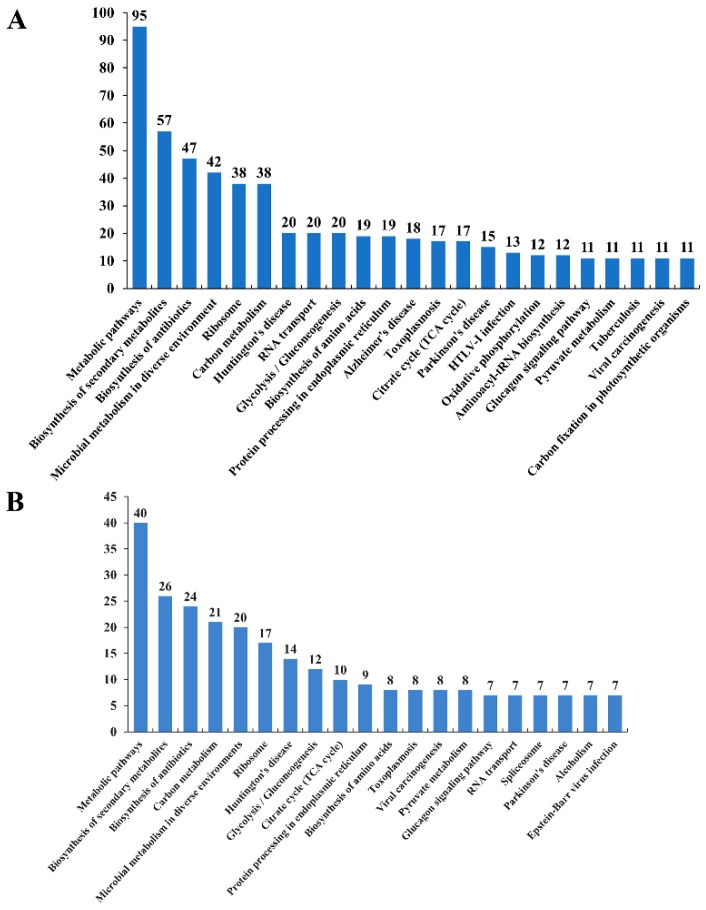
Figure 4.
KEGG pathway analysis of the differentially acetylated proteins in RH and PYS strains. Charts (A,B) represent KEGG pathways of acetylated proteins in RH strain and PYS strain, respectively. The x-axis represents enriched KEGG pathways and the numbers above the bars (y-axis) are the number of acetylated proteins.

