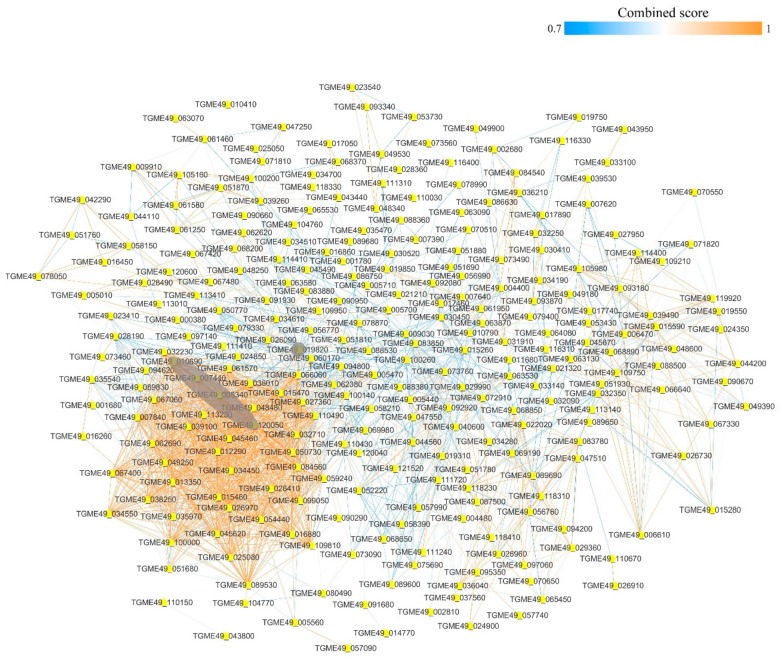
Figure 5.
Protein–protein interaction network of the acetylated proteins in RH strain. Nodes represent the acetylated proteins and edges represent interactors between acetylated proteins. The color of the edges denotes the combined score of interactors. The grey color indicates the major/hub nodes of the protein-protein interaction network.

