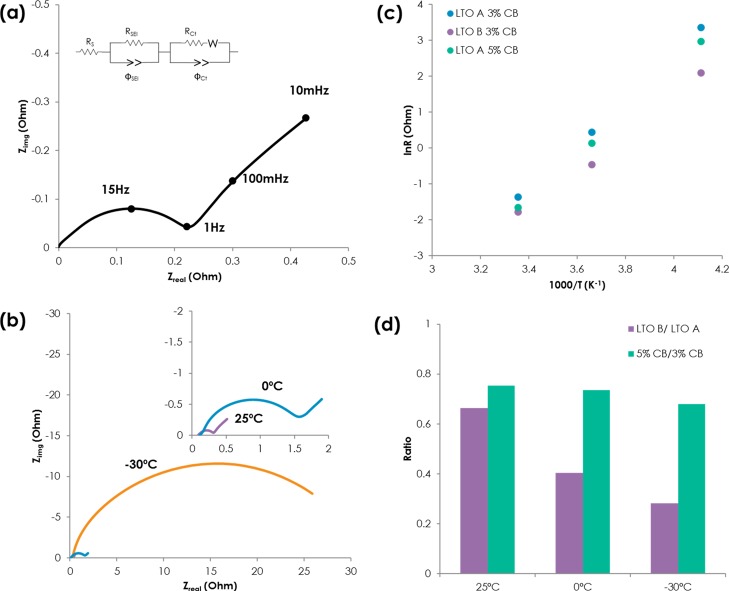
Figure 3.
(a) Representative Nyquist plot of the LMO/LTO cell (inset: equivalent circuit for fitting), (b) Nyquist plot of LMO/LTO A 3 wt % carbon black at 25, 0, and −30 °C, (c) Arrhenius plot of Rct of samples, and (d) relative Rct ratio of LTO A and LTO B (purple), 3 wt % carbon black and 5 wt % carbon black (green).

