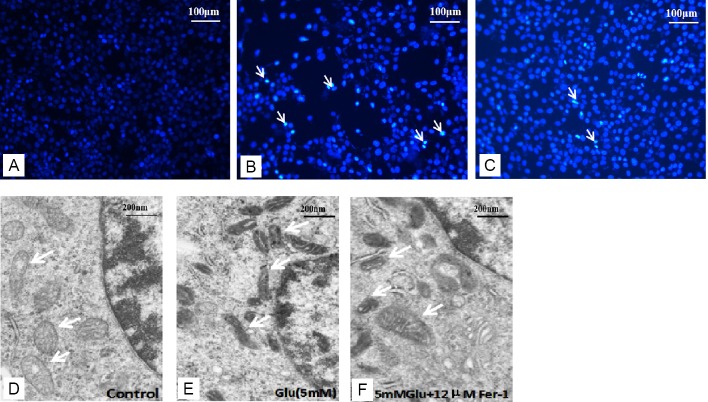
Figure 2.
Effect of ferrostatin-1 on the morphological features of HT-22 cells.
(A–C) 4′,6-Diamidino-2-phenylindole (DAPI) staining of HT-22 cells in (A) control, (B) Glu (5 mM), (C) Glu (5 mM) + Fer-1 (12 μM) groups. The white arrows indicate cell nucleus. (D–F) Transmission electron microscopy was used to observe the mitochondria. The white arrow indicates mitochondria. The mitochondria membrane density increased after the Glu treatment (E) compared with the control group (D) but the changes were smaller in the Glu + Fer-1 group (F). Scale bars: 100 μm in A–C, 200 μm in D–F. Fer-1: Ferrostatin-1; Glu: glutamate; HT-22 cell: a mouse hippocampal neurons cell.

