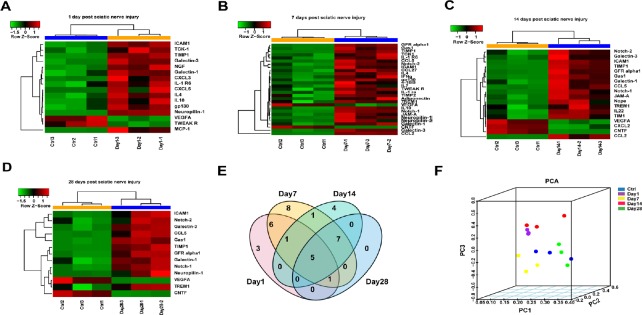
Figure 1.
Overview of differentially expressed cytokines at the distal stump following sciatic nerve transection.
(A–D) Heatmap and hierarchical clustering at 1 (A), 7 (B), 14 (C), 28 (D) days. Protein expression was increased (red) and decreased (green) compared with the control (0 day after sciatic nerve transection). (E) Venn diagram displaying the number of different proteins among the four groups of sciatic nerves at each time point after sciatic nerve transection. (F) Principal component analysis of the differentially expressed cytokines at different time points following sciatic nerve transection. PC: Principal component; PCA: principal component analysis.

