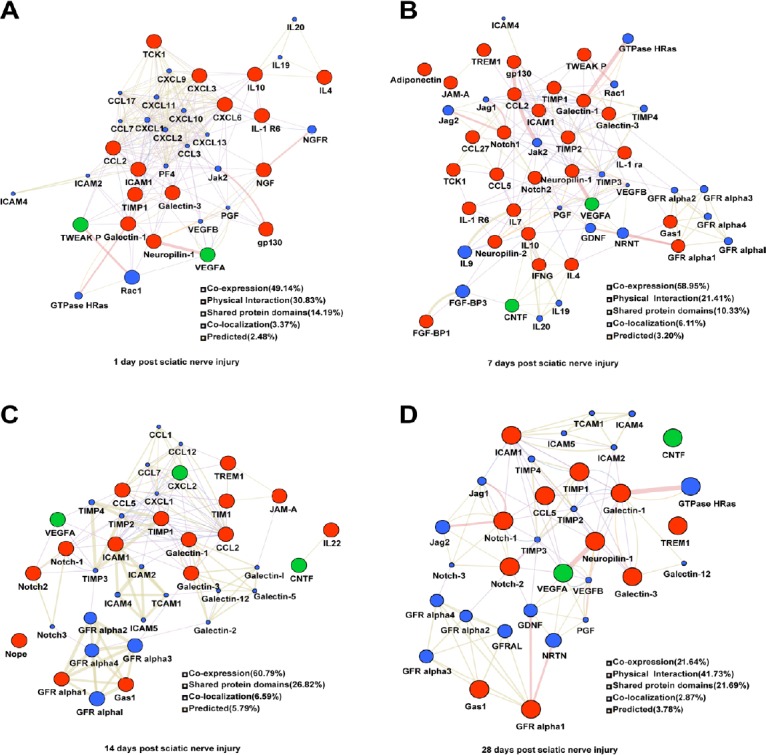
Figure 2.

Networks of protein-protein interactions of the differentially expressed proteins in the distal nerve stump following sciatic nerve transection.
(A–D) Differentially expressed proteins at 1 (A), 7 (B), 14 (C), 28 (D) days. The sizes of the spots in the network represent the weights of the interaction involving the protein. The red spots represent the upregulated proteins and green spots the downregulated proteins at each time point after sciatic nerve transection. The blue spots represent the selected proteins interact with the differentially expressed proteins. The colors of the the connecting lines represent the different interactions between protein and protein. The thickness of the connecting lines represents the score of each connection.
