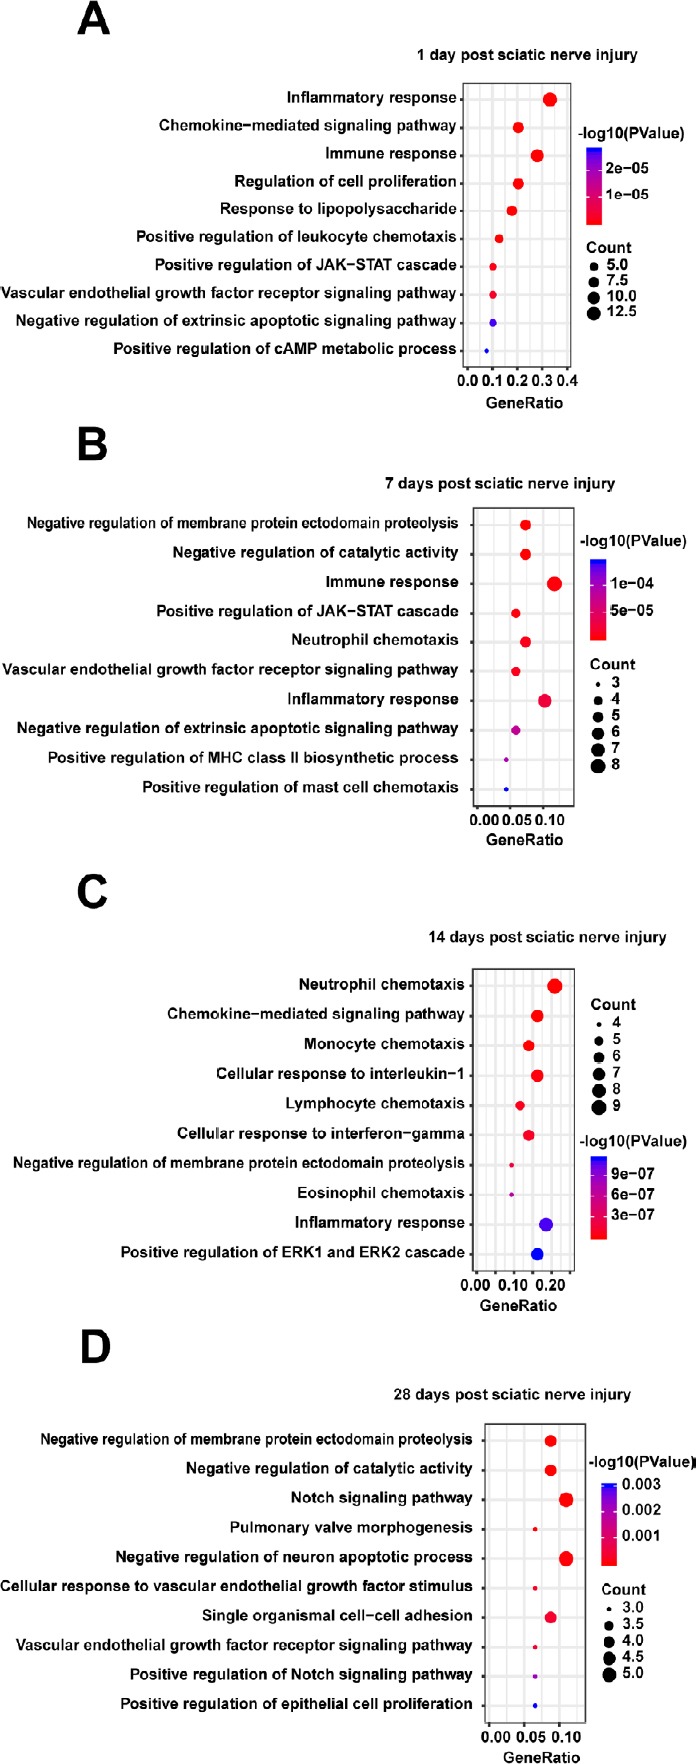
Figure 4.

Gene ontology (GO) biological processes of those proteins enriched in the protein-protein interaction network in the distal nerve stump following sciatic nerve transection relative to all proteins.
(A–D) Differentially expressed proteins at 1 (A), 7 (B), 14 (C), 28 (D) days. The top 10 GO biological processes with P < 0.05 are listed. The x-axis represents the gene ratio, defined as the ratio of the numbers of differentially expressed proteins to all proteins annotated in the GO biological processes using Database for Annotation, Visualization, and Integrated Discovery (DAVID; http://www.david.niaid.nih.gov).
