
Figure 3.
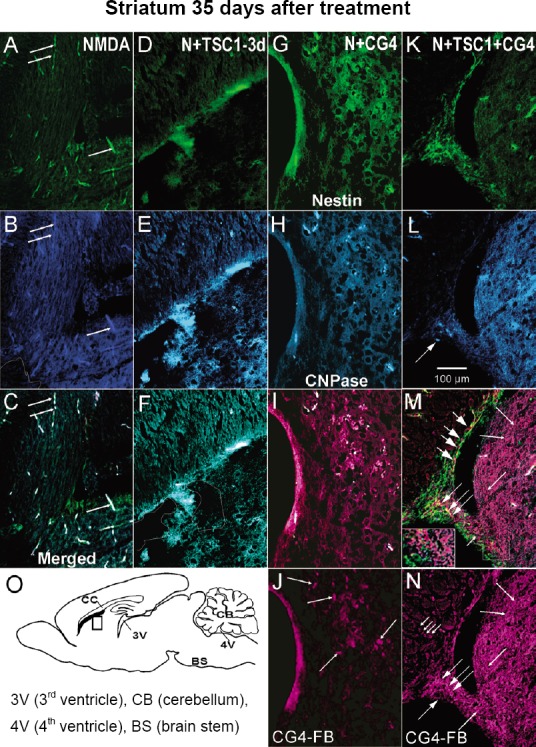
Representative views of the CC and striatum 35 days after treatment.
(A) In the presence of NMDA alone there was considerable nestin-expression loss in the brain parenchyma, just a few nestin-expressing cells were present in the SVZ. Nonetheless, pericytes were nestin-GFP labeled. The blood vessels were auto-fluorescent and the tissue presented a spongy aspect in the striatum, the white outline shows tissue loss. (B) CNPase expression was absent from the white matter regions. (C) The merged image illustrates better the presence of few nestin-expressing cells in the apical portion of the SVZ and the auto-fluorescence of capillaries. The absence of CNPase is clearly appreciated. (D) The injection of NMDA followed by TSC1 3 days after the excitotoxic insult resulted in auto-fluorescence quenching, loss of nestin-expressing cells and some tissue loss in this region. (E) Two kinds of cells expressed CNPase small cells organized as rows in the CC and large flat and fibrous-like cells. (F) The merged image confirms the presence of small nestin-positive cells and some tissue loss has been outlined. (G) When central glial 4 cells-oligodendrocyte progenitors (CG4-OLPs) were injected with NMDA nestin expression was absent in the striatum, and just a few blood vessels were auto-fluorescent. (H) The tissue appears spongy and there is not CNPase expression. (I) The merged picture shows the presence of a few grafted cells and autofluorescent blood vesels. (J) A few FB-labeled grafted cells seen in pseudo-color magenta (arrows) distributed in just one region of the tissue. (K) View of the effects of NMDA with the combinatorial treatment of TSC1 + CG4-OLP grafts where we can appreciate nestin-GFP-expressing cells in the SVZ and the wall of the ventricle. (L) Some small cells expressed CNPase (arrows). (M) The merged picture shows grafted cells intermingled with nestin-labeled host cells (short arrows) or adjacent to the nestin-expressing host cells. This image allows for the visualization of FB+ cells (seen in magenta) arranged in straight and long rows starting from the SVZ towards the striatum brain parenchyma (long arrows with short heads) point to some of these cell rows. At the level of the SVZ FB-grafted cells and nestin-GFP host cells appear to overlap showing spots of yellow fluorescence (medium size arrows). Inset shows in detail FB-labeled cells and host nestin-expressing cells. (N) The striatum was populated by CG4-OLPs FB-labeled (magenta, short headed long arrows). small arrow points to a grafted cell in the SVZ. (O) Diagramatic representation of a sagittal view of mouse brain indicating a single site of injection and the regions from which pictures were taken. CC: Corpus callosum; CG4: central glial 4 cells; CNPase: cyclic nucleotide 3′-phosphohydrolase; FB: Fast Blue; GFP: green fluorescent protein; NMDA: N-methyl-D-aspartate; OLPs: oligodendrocyte progenitors; SVZ: subventricular zone; TSC1: the combination of transferrin and insulin growth factor 1.