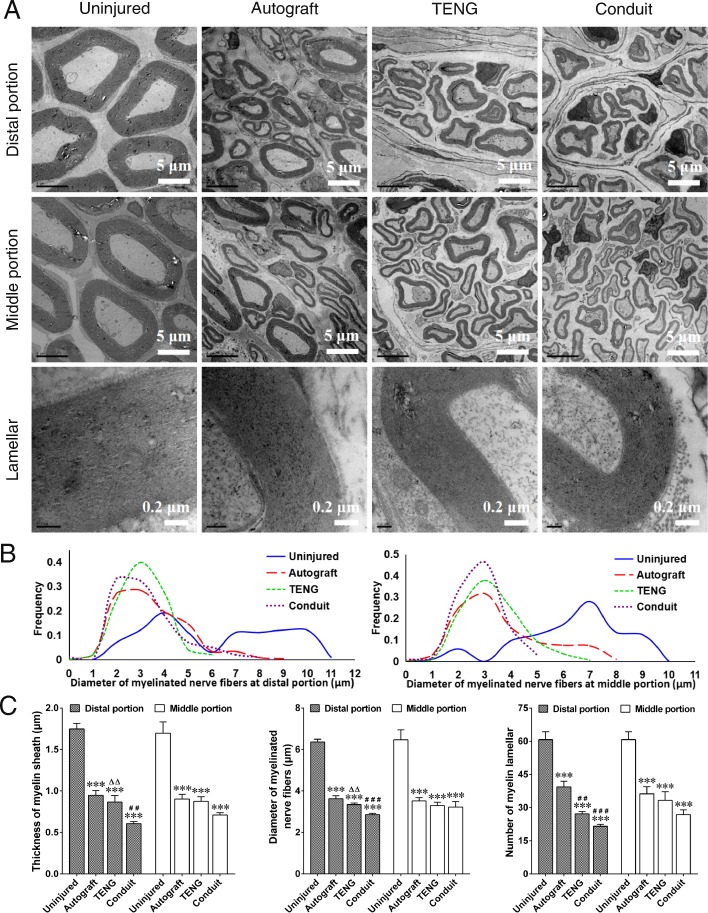
Fig. 4.
TEM observation of regenerated nerve fibers. a Representative TEM image showing that the regenerated nerve fibers dispersed in clusters at both the distal portion and the middle portion in autograft, TENG, and conduit groups, and the myelinated axons were surrounded by clear, thick, electron-dense myelin sheaths with lamellar structure, and the contralateral uninjured side was set as the control group. Scale bars, 5 μm (distal portion and middle portion), and 0.2 μm (lamellar). b Curve graphs of the diameter distribution of the myelin sheaths showing a peak value at about 3 μm at both the distal and the middle portion of the regenerated nerve fibers in 3 grafted groups, and displayed significant differences between each other in terms of the Kolmogorov-Smirnov test, n = 4. c Histograms showing the thickness, diameter, and myelin lamellar number of myelin sheath at the distal and middle portion of regenerated nerve fibers in 3 grafted groups, and the contralateral uninjured side was set as the control group. n = 4; ***p < 0.001 compared with the uninjured group; ##p < 0.01, ###p < 0.001 compared with the autograft group; △△p < 0.01 compared with the conduit group

