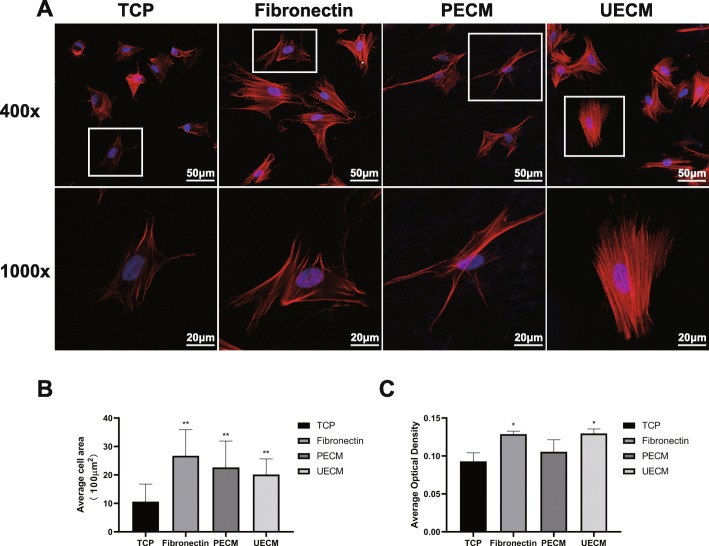
Fig. 5.
Spreading and morphology of cells grown on ECM. a hPDLSC morphologies on different substrates at × 400 and × 1000 magnification. Actin filaments are stained in red by phalloidin, and the nucleus is stained in blue by DAPI. b Quantification of cell area and c the average optimal density of the fluorescence using NIH Image J. All values are mean ± SD; *p < 0.05 and **p < 0.01

