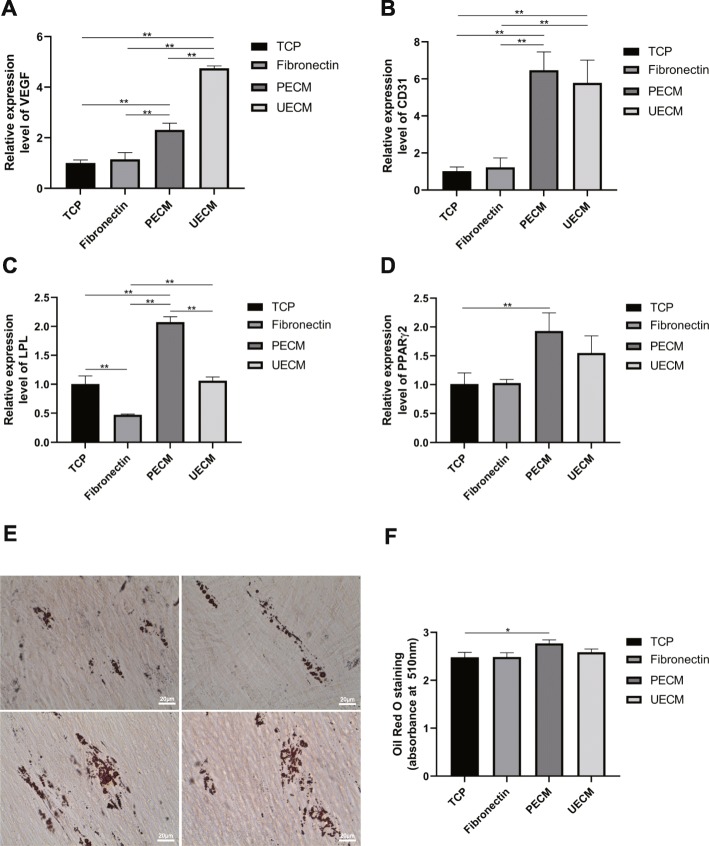
Fig. 7.
Angiogenic and adipogenic differentiation on different substrates. a, b Angiogenesis-related genes. a VEGF and b CD31 expression analyzed on culture day 7 in angiogenic medium by real-time RT-PCR. c, d Adipogenesis-related genes. c LPL and d PPARγ2 expression levels were analyzed on culture day 7 in adipogenic medium by real-time RT-PCR. e After adipogenic induction on different substrates for 21 days, lipid-laden lobules were detected by Oil Red O staining. Scale bar = 20 μm. f Quantitation of Oil Red O staining of day 21 cultures after isopropanol extraction. All values represent the mean ± SD; *p < 0.05 and **p < 0.01

