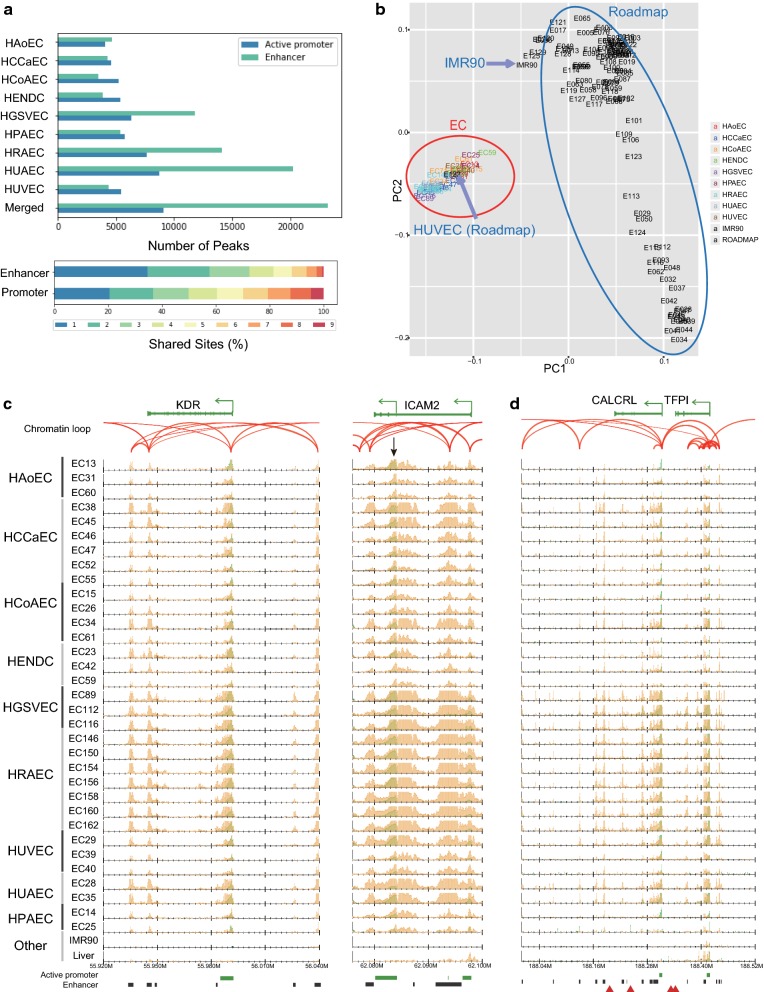
Fig. 2.
ChIP-seq data indicate variation in the chromatin status of ECs. a Top: the number of active promoter and enhancer sites for the nine cell types along with the merged reference sites. Bottom: the percentage of the reference active promoter and enhancer sites shared by 1–9 of the EC types. b PCA plot using H3K27ac read densities. All EC samples in this paper (red circle) as well as 116 cell lines from the Roadmap Epigenomics Project (blue circle) are shown. The label colors indicate the EC types. c, d Normalized read distribution of H3K4me3 (green) and H3K27ac (orange) in representative gene loci c KDR and ICAM2 and d CALCRL and TFPI for all ECs and two other tissues (liver data from the Roadmap and IMR90 cell data from this study). Chromatin loops based on ChIA-PET (read-pairs) are represented by red arches. Green bars, black bars and red triangles below each graph indicate active promoter sites, enhancer sites and GWAS SNPs, respectively

