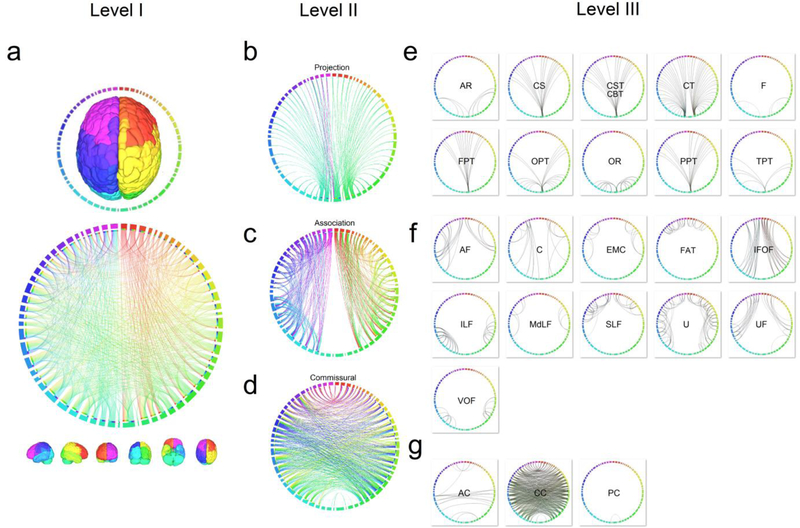
Fig. 8.
The multi-level connectograms of the human structural connectome. (a) The first level of the overall structural connectome shows a dense connections pattern in the average structure connectome. (b) The second level of the connectogram shows the network characteristics in each pathway system. The projection pathway forms a hub structure at thalamus, putamen, and brainstem. The association pathway is constituted of numerous clusters in the brain networks. The commissural pathway has long-range connections between hemispheres that provide global efficiency. (c) The third level of the connectogram reveals the network pattern of each fiber pathways under the projection, association, and commissural system. The connection patterns inherit the characteristics of their belonging pathway system shown in the second level connectogram.

