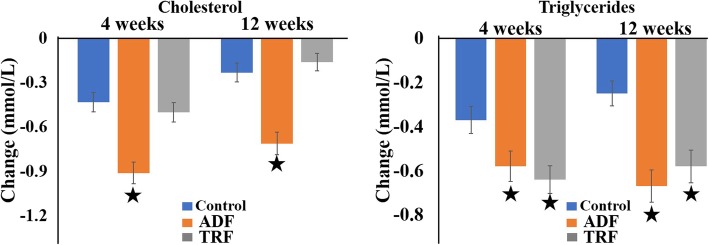
Fig. 3.
Changes in dyslipidaemia at week 4 and week 12. Values are reported as mean ± SEM (standard error of the mean)
ADF achieved a significant decrease in total cholesterol compared to both the control and TRF groups. Triglycerides were significantly decreased in both the ADF and TRF groups compared to the control group.  : P < 0.001;
  : P < 0.05.

