Fig. 2.
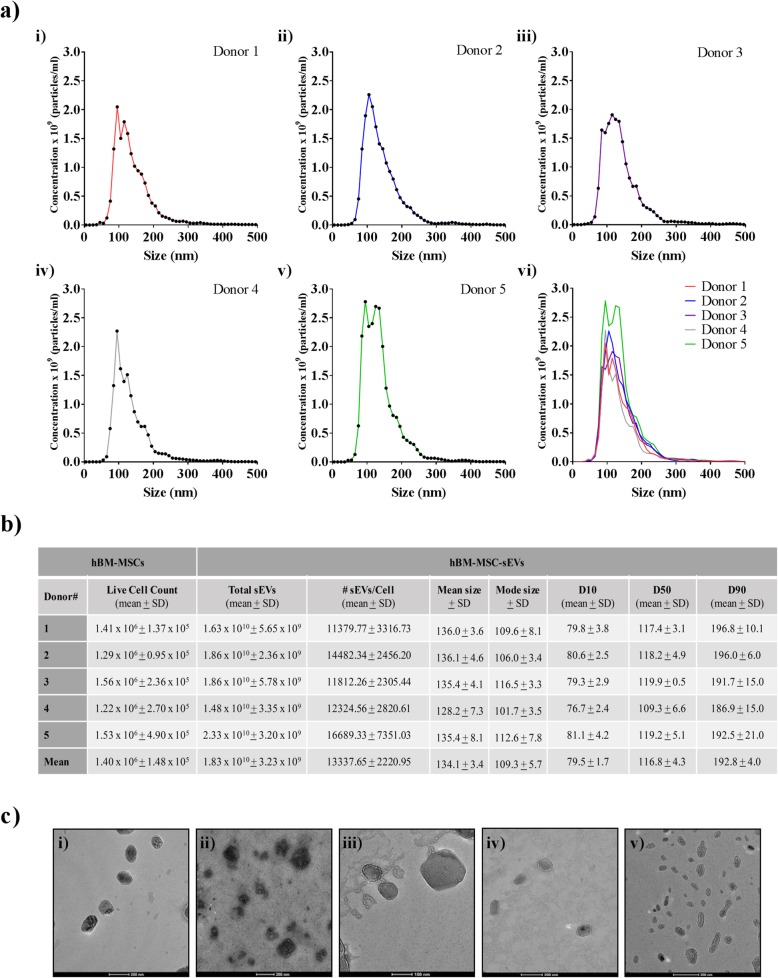
Size distribution analysis of hBM-MSC-sEVs performed with NTA and TEM confirmed small EV category assignment. a hBM-MSC-sEVs from (i) donor 1, (ii) donor 2, (iii) donor 3, (iv) donor 4, and (v) donor 5 were characterized by nanoparticle tracking analysis (NTA) as a means to estimate the hBM-MSC-sEV concentration and determine the EV size distribution. (vi) Superimposed NTA results of all five donors. X-axis designates size (nm) and y-axis designates concentration (mean) at different sizes of five individual healthy hBM-MSC donors (n = 5 donors). b Live cell counts of hBM-MSCs ± S. D, total mean concentration of hBM-MSC-sEV ± S. D, number of hBM-MSC-sEVs produced per hBM-MSC as a method of EV characterization, mean and mode size ± SD of hBM-MSC-sEVs, D10, D50, and D90 are shown as a method of nanoparticle size analysis. c Transmission electron microscopy (TEM) analysis confirmed the presence of hBM-MSC-sEV with the expected morphology, bilayer membrane, and size of small EVs (< 200 nm) (scale bars: D1, D2, D4, D5 = 200 nm, D3 = 100 nm). The data shown in a and b represent five hBM-MSC donors (n = 5 donors) analyzed in three independent trials (n = 3 experiments)

