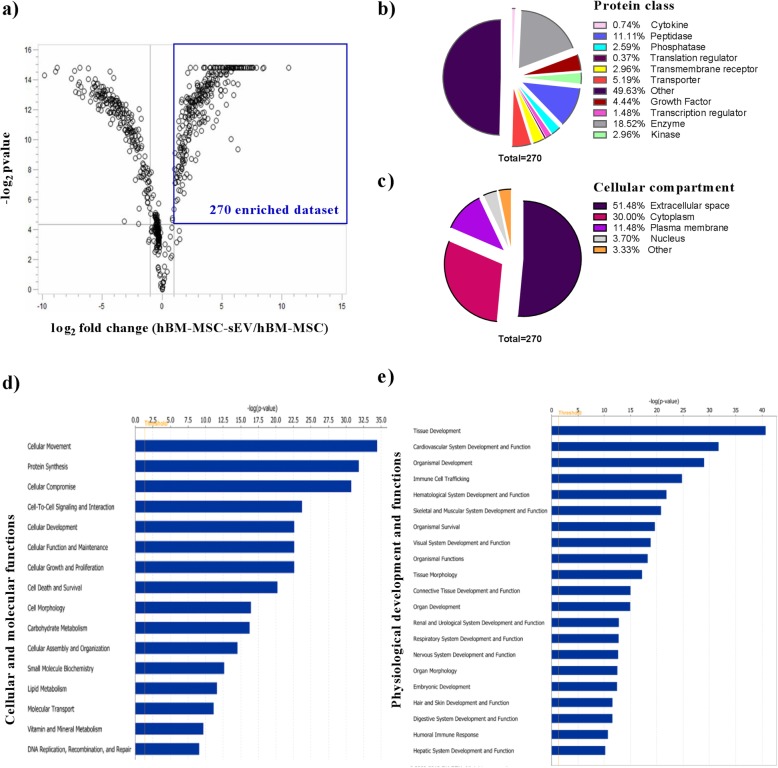
Fig. 4.
The twofold enriched hBM-MSC-sEV proteomics dataset analyzed for biological significance. Twofold enriched hBM-MSC-sEV protein dataset as compared to the parental hBM-MSCs. a Described in a volcano plot showing the significantly enriched proteins (upper right corner) in the overall proteomics dataset. b categorized into protein class, and c categorized into subcellular compartments using the Ingenuity Pathway Analysis (IPA) bioprofiler tool. The twofold enriched hBM-MSC-sEV protein dataset organized into d significantly upregulated cellular and molecular functions and e significantly upregulated physiological development and functions using IPA. Y-axis shows the significantly upregulated pathways and the X-axis shows the −log10 p value with a threshold set at 1.30 (−log10 p value) or p value of 0.05. Significantly upregulated pathways were calculated using a right-tailed Fisher’s exact test in IPA

