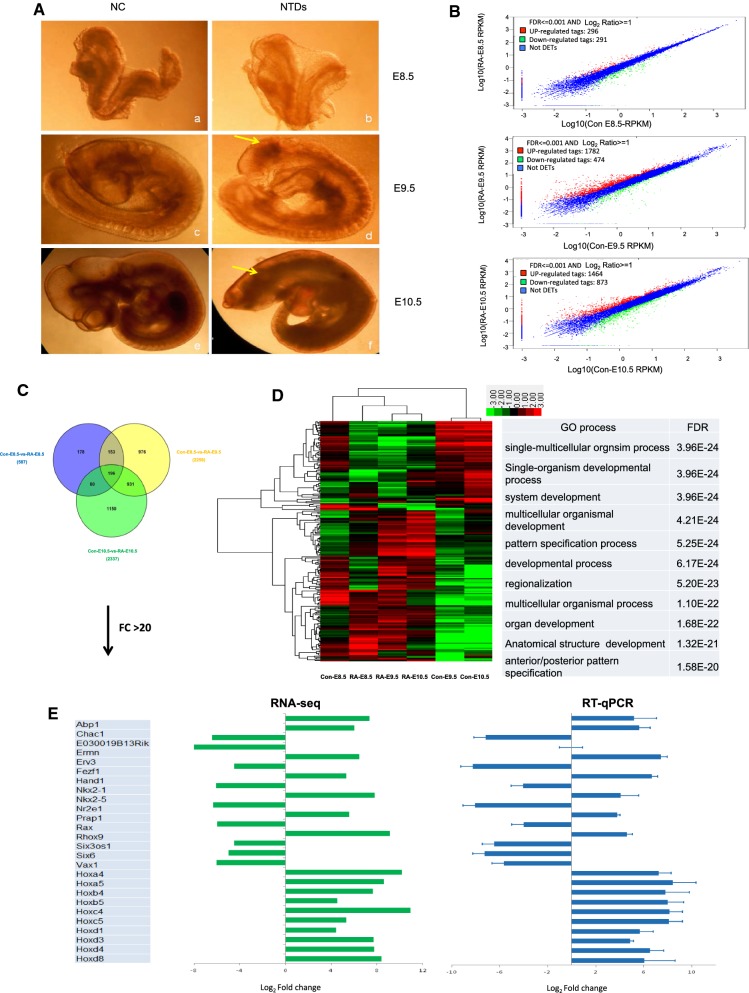
Fig. 1.
RA-induced mouse NTDs accompanied by dynamic transcriptome changes. A RA-induced anencephaly in C57BL/6 mouse embryos. a: Con-E8.5, b: RA-E8.5, c: Con-E9.5, d: RA-E9.5, e: Con-E10.5, f: RA-E10.5. Arrow indicated the abnormal section. B Differentially expressed genes (DEGs) identified in Con-E8.5-vs-RA-E8.5, Con-E9.5-vs-RA-E9.5 and Con-E10.5-vs-RA-E10.5 comparisons. C Intersection analysis of DEGs by Venny analysis. The overlaps represent the genes co-expressed in Con-E8.5-vs-RA-E8.5, Con-E9.5-vs-RA-E9.5 and Con-E10.5-vs-RA-E10.5 comparisons. D Hierarchical clustering plot showing representative expression patterns of 196 DEGs during mouse neural tube development. These genes were mainly classified into two categories. The top GO terms and corresponding enrichment P values are shown on the right side. E RT-qPCR validation of 26 DEGs identified by RNA-seq. Actb was used as control. Data are shown as the mean (SD; n = 3). P < 0.05 indicates statistical significance. Twenty five genes have a statistically significant change in expression but not the Ermn gene

