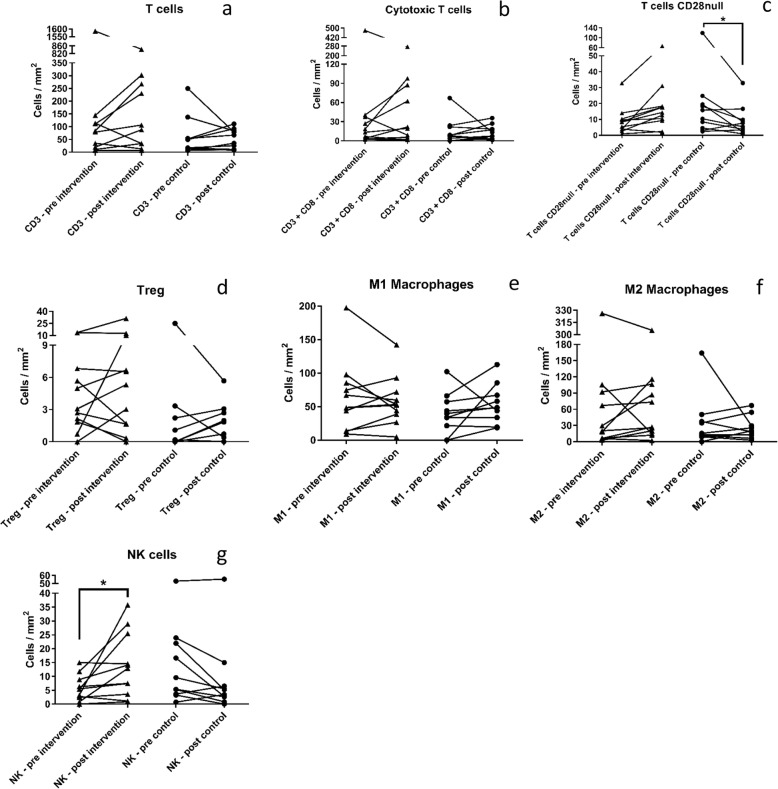
Fig. 3.
a Graph depicting amount of total CD3+ T cells. b Graph depicting amount of CD3+/CD8+ cytotoxic T cells. c Graph depecting amount of CD28null T-cells. d Graph depicting amount of FOXP3+ T regulatory. e Graph depicting amount of CD68+/CD206− M1 macrophages. f Graph depicting amount of CD68+/CD206+ M2 macrophages. g Graph depicting amount of CD3−/CD8+ natural killer cells. Triangles show the pre and post for each patient in the intervention group (n = 11). Circles show the pre and post for each patient in the control group (n = 10). Bars show group mean. Asterisk signifies a significant change from pre to post (p ≤ 0.05). All graphs are shown in cells/mm2

