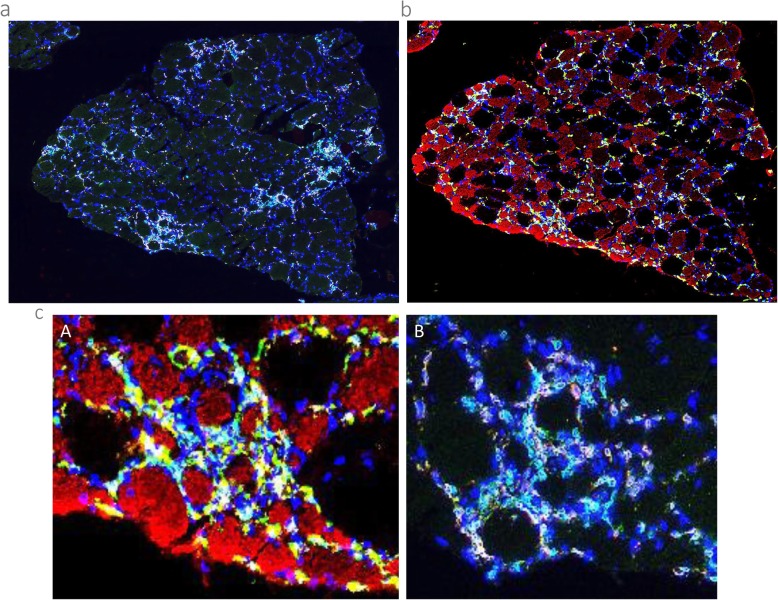
Fig. 4.
a Overview of a T cell staining CD-3 (green), CD-8 (red) and nuclei (Blue). See b for a macrophage staining of the same area. b Overview of a macrophage staining CD-68 (green), CD-206 (yellow), MHC Fast (red) and Nuclei (blue). See a for a T cell staining of the same area. c Close up comparison of the same area showing overlapping macrophage and T cell staining around small-sized type 2 fibres. (A) Macrophage staining, with CD-68 (green), CD-206 (yellow), MHC Fast (red) and Nuclei (blue). (B) T cell staining, with CD-3 (green), CD-8 (red) and Nuclei (blue)

