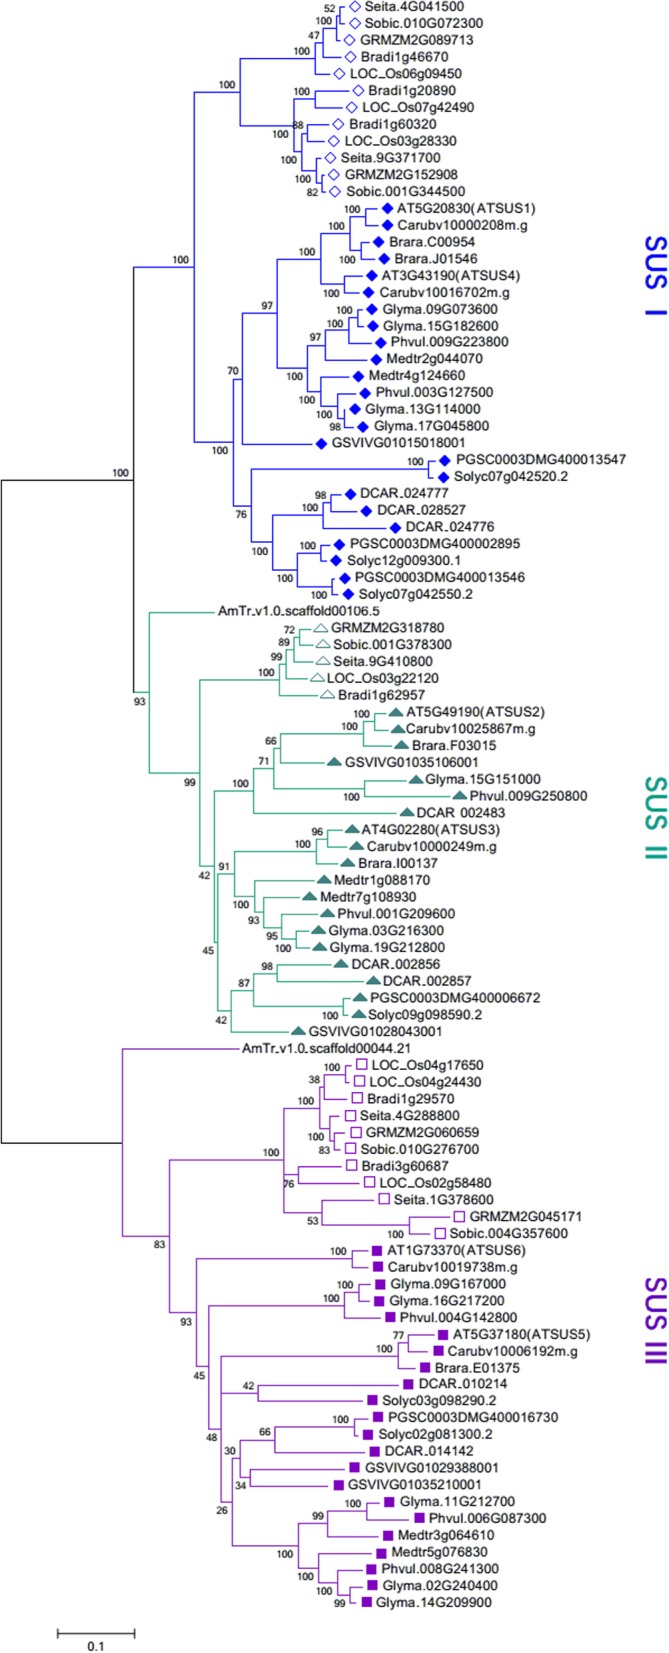
Fig. 2.

Phylogenetic analysis of 96 SUS genes from 16 angiosperm species. A Maximum Likelihood (ML) tree was constructed with MEGA 7.0 software [27] using amino acid sequences based on the Whelan And Goldman (WAG) model [28], the numbers on the branches represent the bootstrap supports. SUS genes from monocots are represented by hollow shapes, while those from dicots are represented by solid shapes
