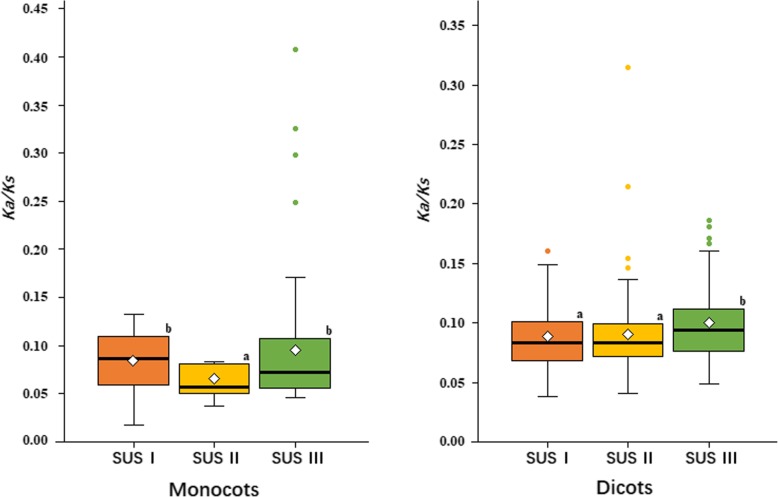
Fig. 6.
The overall ω values of three SUS subfamily genes in monocots and dicots. The top and bottom edges of the box indicate the upper and lower quartiles, the central black line show median value and the diamond show mean value. The whiskers extend 1.5 times of the interquartile range beyond the edges of the box. Different letters above the boxes indicate significant differences (one way-ANOVA and Dunnett’s T3 test; P < 0.05)

