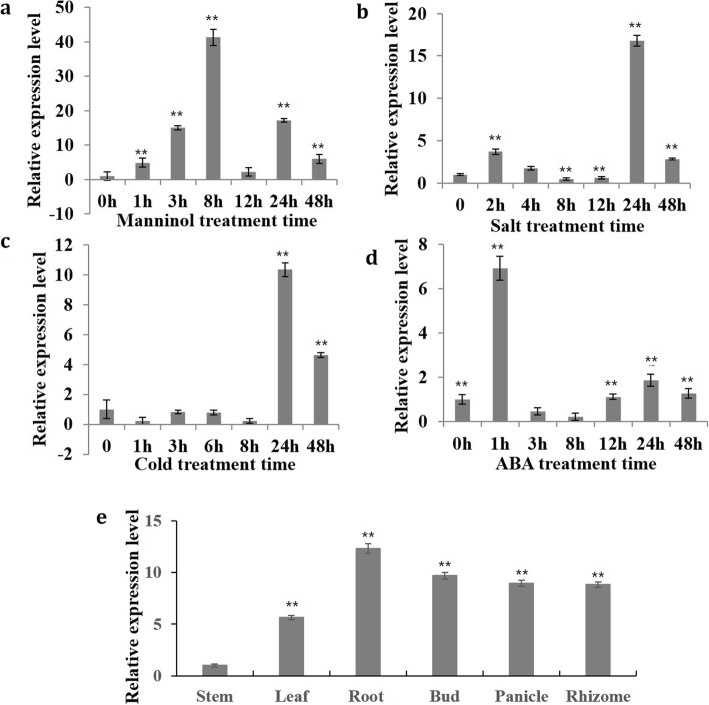
Fig. 1.
The expression patterns of LcMYB2 under different treatments and its tissue-specific expression. a to d Expression of LcMYB2 in the seedlings of 8-week-old sheepgrass were treated with or without 300 mM mannitol, 400 mmol/L NaCl, cold and 100 μmol/L ABA treatments for 0, 1, 3, 8, 12, 24 h or 48 h after stress treatments. e LcMYB2 expression in stem, leaf, root, bud, panicle and rhizome of 1-year-old sheepgrass in flowering period. LcACTIN was used as a positive control for data normalization. Three independent replicates of measurements were performed for each time point, and the data are shown as the mean ± standard deviation (SD) (n = 3)

