
Figure 2.
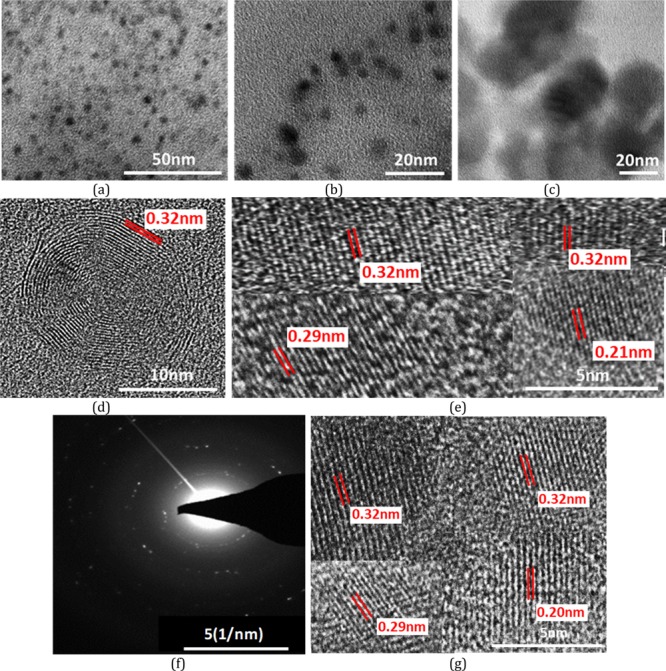
(a) TEM image of bare CDs showing spherical CD formation at lower magnification (b−c). Images at higher magnification depicting large size distribution. (d) HRTEM image of bare CDs showing onion-shaped hexagonal rings. (e) HRTEM image of bare CDs showing parallel planes. (f) SAED pattern of bare CDs showing highly crystalline behavior. (g) HRTEM image of SFCDs.