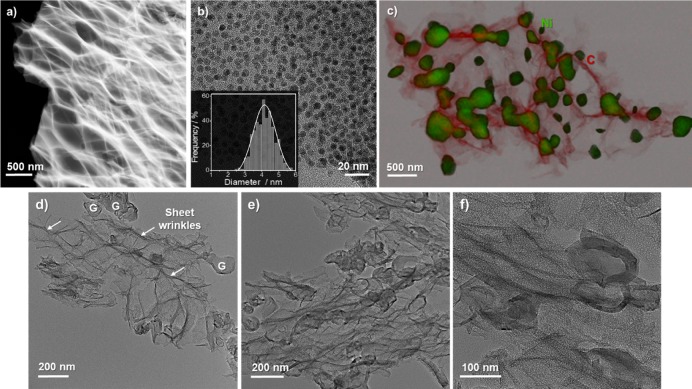
Figure 3.
Representative TEM micrographs: (a) Dark-field (DF) STEM image of MDF Ni H2O 300 °C sample; (b) bright-field TEM image of the same sample showing the homogeneous distribution of Ni nanoparticles (particle size distribution shown in the inset of the figure); and (c) combined elemental mapping and STEM images of MDF Ni H2O 1000 °C. The green-colored area corresponds to the nickel phase, while the red one corresponds to carbon. (d–f) Representative TEM micrographs of MDF Ni H2O 1000 °C after acid washing (the letter G represents the hollow ordered graphitic structures, and the arrows show the edges and corrugations on the sheets’ surface).

