Figure 5.
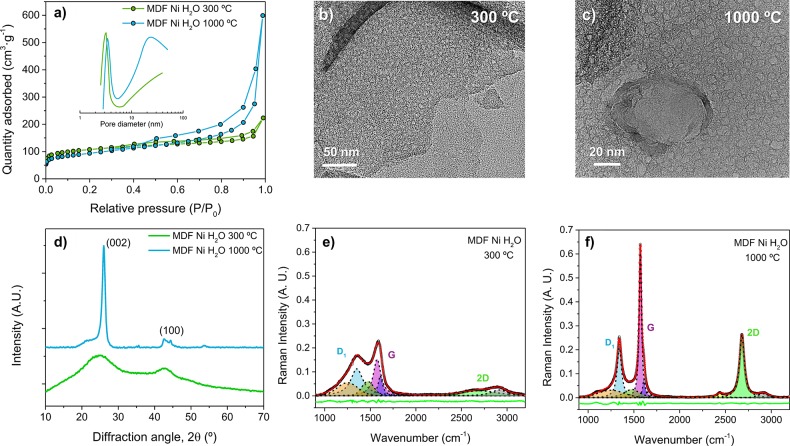
(a) N2 adsorption/desorption isotherms and pore size distributions (inset of the figure) calculated by applying the BJH method to the desorption data of MDF Ni H2O 300 and 1000 °C samples. (b, c) High-resolution TEM images showing the porous structure. (d) X-ray diffraction patterns of MDF Ni H2O 300 and 1000 °C. (e, f) Raman spectra of MDF Ni H2O 300 and 1000 °C. Spectra were deconvoluted into relevant carbonaceous bands as described in the main text, using a least-squares method and pseudo-Voigt line shapes. The green line corresponds to the residual, while the red one represents the fitted data.

