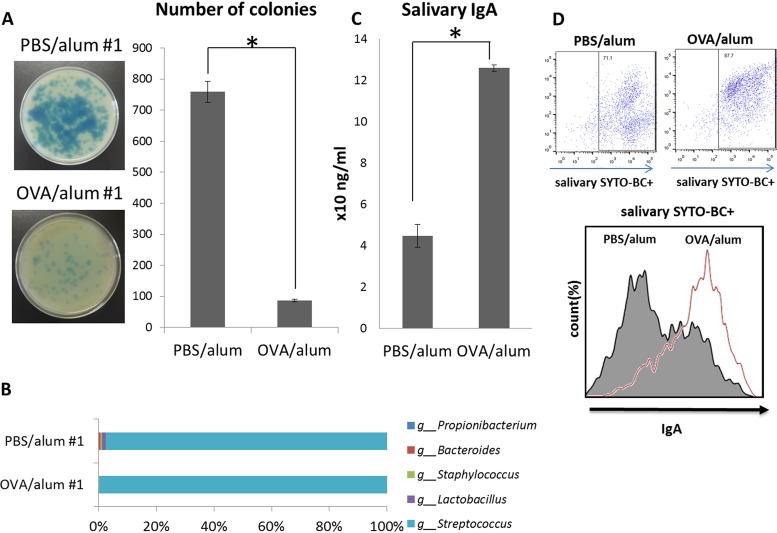
FIG 8.
Quantification of hydrogen peroxide-producing bacteria and salivary IgA in the oral cavity of ovalbumin (OVA) allergic mice. Saliva was collected from OVA allergic mice (OVA/alum 1 to 3) and control mice (phosphate-buffered saline [PBS]/alum 1 to 3) and inoculated onto three Prussian blue plates. After an overnight anaerobic incubation, hydrogen peroxide-producing bacteria formed colonies with blue halos. The plates of OVA/alum 1 and PBS/alum 1 are presented (left). The right graph shows the mean numbers of colonies with blue halos for the OVA/alum and PBS/alum groups (A). The percentages of detected genera of bacteria in both OVA/alum 1 and PBS/alum 1 are indicated by a horizontal bar graph (B). Saliva was collected from both OVA/alum and PBS/alum mice, and salivary IgA was quantified using an IgA ELISA kit (C). Oral bacteria in the saliva of both groups of mice were stained using SYTO BC and goat anti-mouse IgA-Alexa Fluor 647. The histogram presents the mean fluorescent intensities of IgA-Alexa Fluor 647-positive oral bacteria in SYTO BC-positive oral bacteria from OVA/alum and PBS/alum mice (D). Results are presented as the mean ± SD (n = 3), and they represent three independent experiments. *, P < 0.05.

