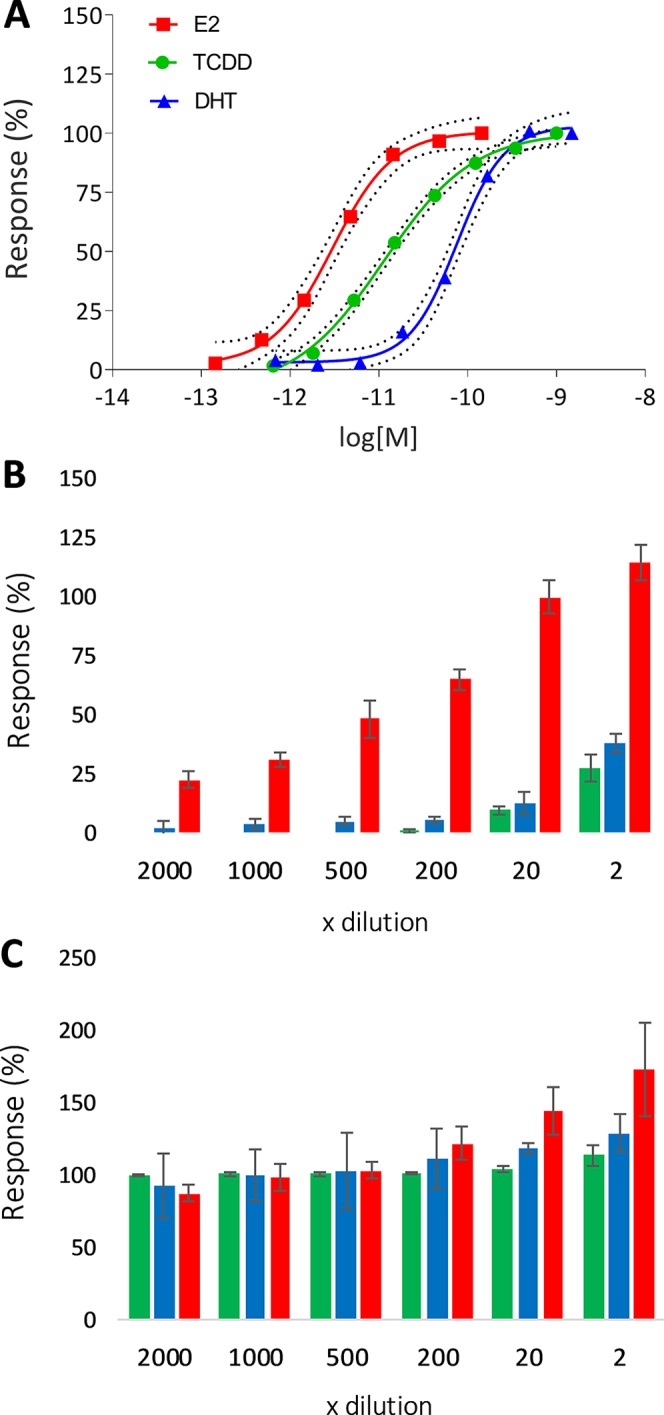
Figure 3.

Concentration–response curves (A) with 95% confidence intervals of ER, AR, and DR responsive cell lines exposed to E2 (red), DHT (blue), and TCDD (green), respectively (n = 3). Agonistic (B) and antagonistic (C) activity of the AF extract represented as luminescence response relative to the highest response of the respective positive control (average % ± SD, n = 3). For antagonism experiments (C), extract dilutions were co-exposed with 4, 150, and 30 pM of E2, DHT, and TCDD, respectively. “x dilution” represents the final dilution factor of the AF sample.
