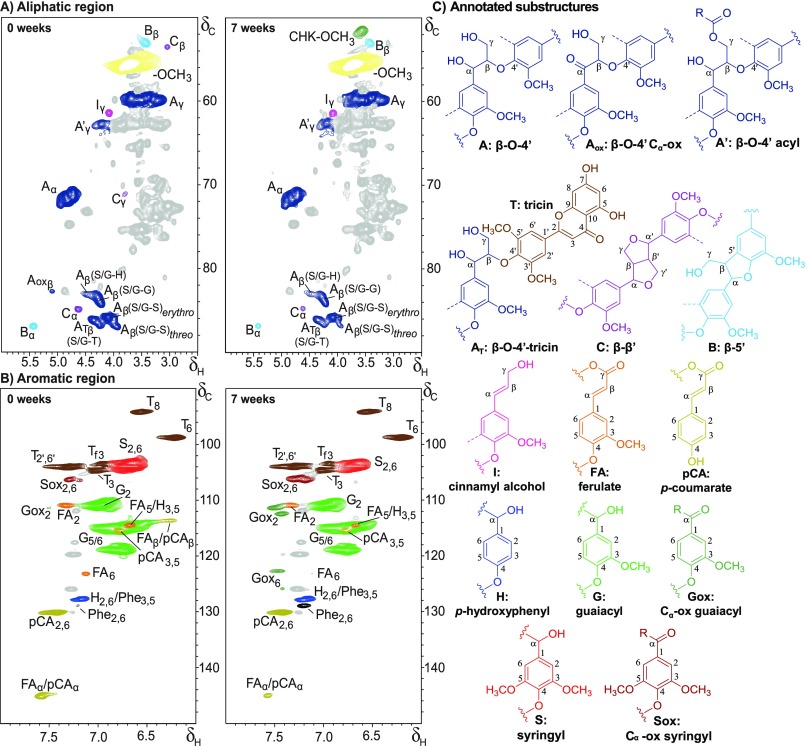
Figure 4.
Aliphatic (A) and aromatic (B) regions of 1H–13C HSQC NMR spectra of free lignin isolates from untreated (left) and 7 week C. subvermispora-treated (right) wheat straw and annotated substructures (C). Dotted lines represent −H or −OCH3. Wavy lines indicate main positions for further coupling. Chemical shift assignments are reported in Table S6. Unassigned signals in gray; amino acid residues (Phe, phenylalanine) in black. The aromatic regions of free lignin isolates presented correlation peaks of impurities and/or isolation artifacts, at similar intensities in untreated and treated samples. These unassigned peaks could be removed by classic Björkman chemical purification, but this purification also led to further fractionation of the lignin due to the fact that a major part of the lignin remained insoluble in 2:1 dichloroethane/ethanol (data not shown).51 As the unassigned peaks were well resolved and, therefore, expected not to interfere with our analysis, purification of the samples was not performed.

