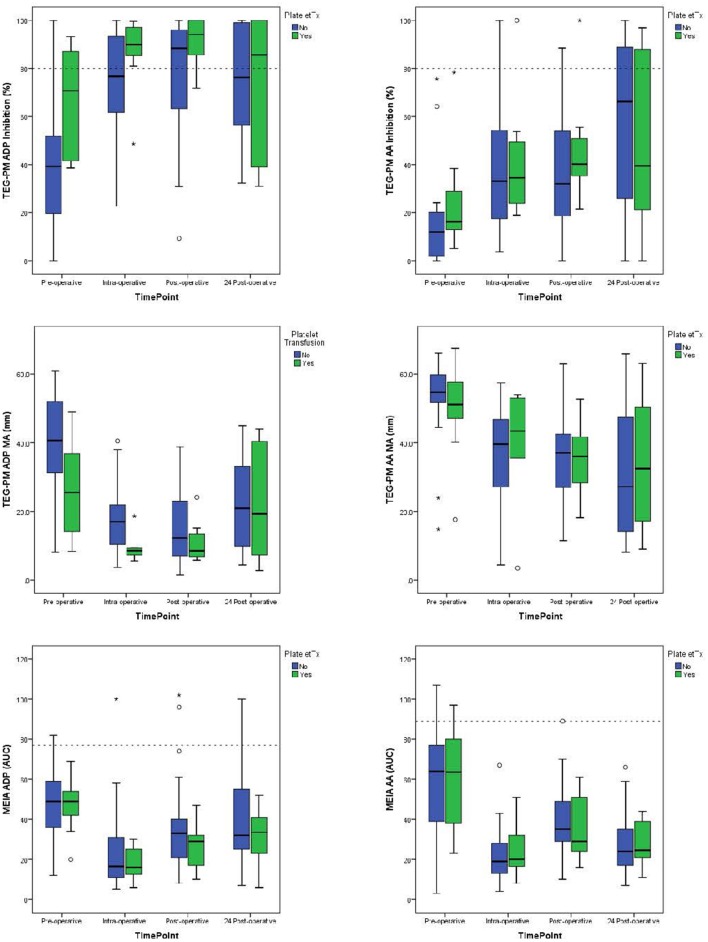
Figure 1.
Median values for TEG-PM Inhibition, TEG-PM MA, and MEIA at the ADP and AA receptors for each time point. The blue bars represent test results for patients who required platelet transfusion and the green bars represent patients who did not require platelet transfusion. Dashed reference lines on inhibition graphs signifying significant inhibition at 80%. Reference line on MEIA graph signifies 10% of the reference range for children 1–4 years of age (14). TEG-PM, thromboelastography with platelet mapping; MA, maximum amplitude; ADP, adenosine diphosphate receptor; AA, arachidonic acid receptor; MEIA, multiple electrode impedance aggregometry; AUC, area under the curve. °Outliers (1.5–3x IQR); *Extreme outliers (>3x IQR).

