
Figure 4.
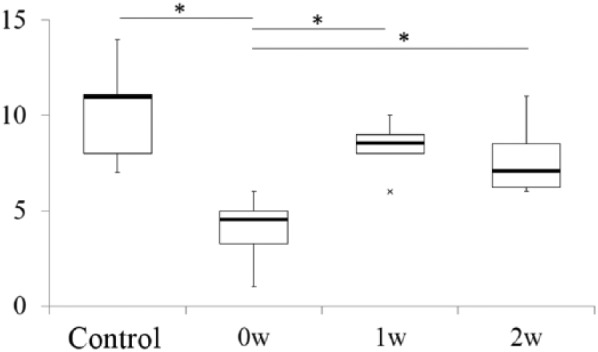
Histological scores of partial thickness cartilage defect (PTCD) following interventions. Box plot showing a comparison of histological scores between the 4 groups. *P < 0.05. Cross (×) represents outliers.
Official websites use .gov
A
.gov website belongs to an official
government organization in the United States.
Secure .gov websites use HTTPS
A lock (
) or https:// means you've safely
connected to the .gov website. Share sensitive
information only on official, secure websites.
Histological scores of partial thickness cartilage defect (PTCD) following interventions. Box plot showing a comparison of histological scores between the 4 groups. *P < 0.05. Cross (×) represents outliers.