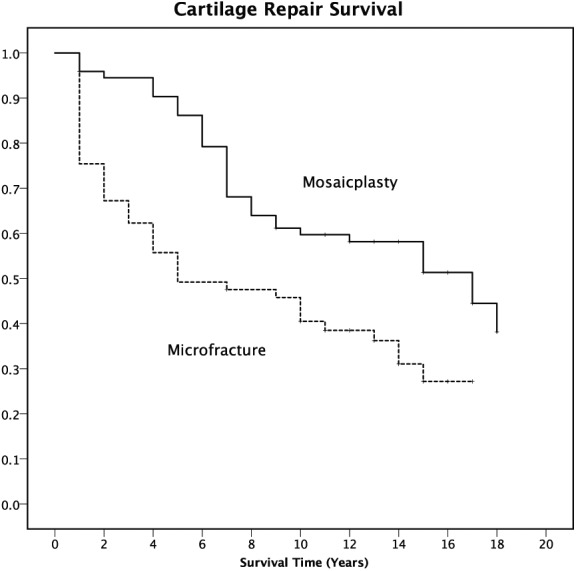
Figure 2.

Kaplan-Meier survival functions plot for the event “failure” (a knee replacement procedure in the same knee or Lysholm score <65) after cartilage repair surgery (Mosaicplasty solid line; Microfracture dashed line) of a subgroup stratified for age and size of treated lesion (n=134).
