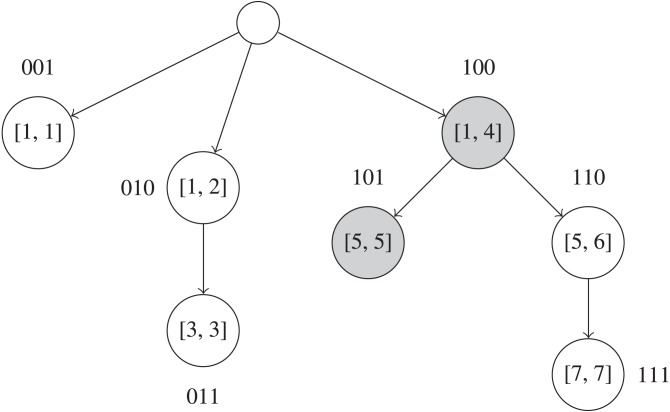
Figure 3. Example of a Fenwick tree on UMI frequencies in the interval [1, 7].
Each node contains a BK-tree that has all UMIs sequences with frequency values in the interval that node describes. The binary labels for each node are used to implicitly index the Fenwick tree’s nodes in a flat 1D array. As an example query, shaded nodes in the Fenwick tree must be visited to find UMIs that have frequencies ≤5 and are within a certain edit distance from the queried UMI. Each of those nodes’ BK-trees must be queried to find UMI sequences.

